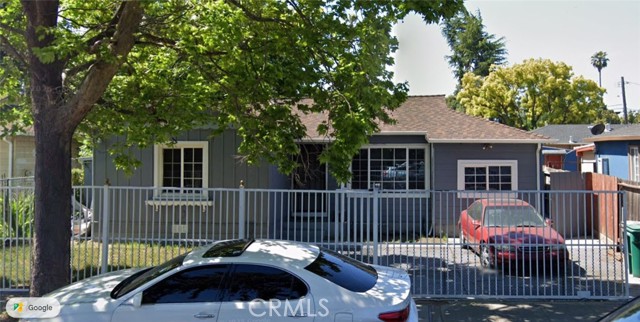
9843 Edes, Oakland, CA 94603
9843 Edes, Oakland, CA 94603
Property Description
Investor opportunity in East Oakland! This 3 bed, 1 bath home on Edes Ave offers easy access to I-880, the Oakland Airport, and San Leandro. The property needs renovation and is priced accordingly a great project for flippers, buy-and-hold investors, or contractors looking to add value in the Bay Area. Cash or hard money, sold as-is, quick close. No wholesalers. Seller holds equitable interest. Buyer to verify all information, including square footage, permits, and condition. Cooling: Central Air
Features & Amenities
Property Details
Mortgage Calculator
Current Rates
Comparative Market Analysis
Affordable Tier · 5 active · 5 closed
Oakland · Single Family Residence
Listed in line with the median closed sale of $355,000.
Price Position
Aligned with the market — fair pricing for the comps.
Active Properties (5)
Active Comparables
| Address | City | Year | BD | BTH | SqFt | LotSz | LP/SqFt | LP | DIM | Score |
|---|---|---|---|---|---|---|---|---|---|---|
| 526 Douglas Ave | Oakland | 1955 | 2 | 1 | 798 | 2,475 | $470 | $375,000 | 75 | 84 |
| 1332 103Rd Ave | Oakland | 1926 | 2 | 1 | 878 | 3,300 | $416 | $365,000 | 278 | 79 |
| 1027 76Th Ave | Oakland | 1941 | 2 | 1 | 912 | 4,000 | $406 | $369,900 | 66 | 78 |
| 1112 82Nd Ave | Oakland | 1925 | 2 | 1 | 849 | 2,770 | $459 | $390,000 | 116 | 75 |
| 1314 99Th Ave | Oakland | 1939 | 2 | 1 | 1,172 | 3,760 | $324 | $380,000 | 99 | 74 |
| Total: 5 · Average | 2.0 | 1.0 | 921.8 | 3,261 | $415 | $375,980 | 126.8 | |||
| Median | 878 | $375,000 | ||||||||
Closed Properties (5)
Closed Comparables
| Address | City | Year | Date | BD | BTH | SqFt | LotSz | LP | SP | SP/SqFt | SP/LP | DIM | Score |
|---|---|---|---|---|---|---|---|---|---|---|---|---|---|
| 331 Stoneford Ave | Oakland | 1942 | 08/07/2026 | 3 | 2 | 1,026 | 4,056 | $405,000 | $390,000 | $380 | 0.96 | 44 | 86 |
| 10737 Pearmain St | Oakland | 1923 | 06/18/2026 | 2 | 1 | 790 | 3,900 | $299,000 | $355,000 | $449 | 1.19 | 37 | 85 |
| 9820 B St | Oakland | 1922 | 07/17/2026 | 2 | 1 | 800 | 4,600 | $330,000 | $300,000 | $375 | 0.91 | 164 | 79 |
| 2224 108th Ave | Oakland | 1945 | 08/17/2026 | 2 | 1 | 1,024 | 4,040 | $358,000 | $380,000 | $371 | 1.06 | 33 | 77 |
| 1439 92nd Ave. | Oakland | 1922 | 09/29/2026 | 2 | 1 | 874 | 3,360 | $399,000 | $350,000 | $400 | 0.88 | 85 | 76 |
| Total: 5 · Average | 2.2 | 1.2 | 902.8 | 3,991.2 | $355,000 | $355,000 | $395 | — | 72.6 | ||||
| Median | 874 | $355,000 | $355,000 | ||||||||||
Market Analysis
List vs Sale $/SqFt
Sale Price Trend
Days on Market
Sale vs List Price
This analysis was generated automatically from MLS data. For an in-depth, human-reviewed valuation, contact Joseph Sardella at josephsardella@gmail.com.