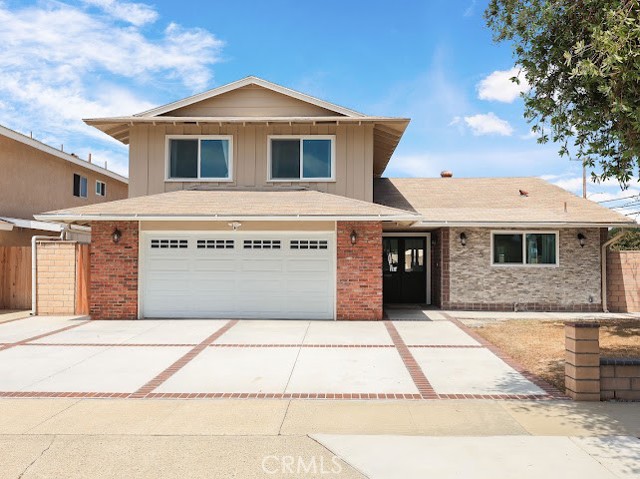
9451 Hyannis Port Dr, Huntington Beach, CA 92646
9451 Hyannis Port Dr, Huntington Beach, CA 92646
Property Description
Welcome to 9451 Hyannis Port Drive, a beautifully fully remodeled home situated on a desirable corner lot in Huntington Beach. This move-in-ready residence features a fresh, modern interior with thoughtfully selected finishes and upgrades throughout. The spacious corner lot offers added privacy, great curb appeal, and potential for an ADU, providing an opportunity for additional living space or future rental income. Conveniently located near shopping, dining, parks, schools, and just minutes from the beach. A wonderful opportunity to own a turnkey home in Huntington Beach with both immediate enjoyment and future potential. Buyer to verify all information, including ADU feasibility, permits, square footage, and development requirements with the appropriate authorities.
Features & Amenities
Property Details
Mortgage Calculator
Current Rates
Comparative Market Analysis
Luxury Tier · 5 active · 5 closed
Huntington Beach · Single Family Residence
Listed 3.9% below the median closed sale of $1,820,000. Price per sqft ($882) is a 11% premium to closed comps ($798). Closed comps sold at 106% of list — strong seller's market. Luxury tier — fewer comparable sales widen the confidence range.
Price Position
Aligned with the market — fair pricing for the comps.
Active Properties (5)
Active Comparables
| Address | City | Year | BD | BTH | SqFt | LotSz | LP/SqFt | LP | DIM | Score |
|---|---|---|---|---|---|---|---|---|---|---|
| 10051 Cutty Sark | Huntington Beach | 1964 | 5 | 3 | 1,982 | 6,000 | $908 | $1.80M | 10 | 91 |
| 9112 Hyde Park Drive | Huntington Beach | 1968 | 5 | 3 | 2,431 | 6,720 | $711 | $1.73M | 2 | 88 |
| 19782 Felcliff | Huntington Beach | 1972 | 5 | 3 | 1,898 | 6,000 | $1,001 | $1.90M | 23 | 88 |
| 8712 Mossford Dr. | Huntington Beach | 1972 | 5 | 3 | 1,898 | 6,000 | $869 | $1.65M | 45 | 87 |
| 19352 Brookhurst | Huntington Beach | 1960 | 4 | 3 | 2,200 | 6,000 | $816 | $1.79M | 12 | 87 |
| Total: 5 · Average | 4.8 | 3.0 | 2,081.8 | 6,144 | $861 | $1.77M | 18.4 | |||
| Median | 1,982 | $1.79M | ||||||||
Closed Properties (5)
Closed Comparables
| Address | City | Year | Date | BD | BTH | SqFt | LotSz | LP | SP | SP/SqFt | SP/LP | DIM | Score |
|---|---|---|---|---|---|---|---|---|---|---|---|---|---|
| 9392 Greenwich | Huntington Beach | 1964 | 05/05/2026 | 3 | 2 | 1,982 | 6,120 | $1.20M | $1.56M | $787 | 1.30 | 36 | 90 |
| 9552 Sailfish Drive | Huntington Beach | 1964 | 10/05/2026 | 5 | 4 | 2,655 | 6,000 | $1.98M | $1.96M | $738 | 0.99 | 83 | 85 |
| 9301 Portsmouth Drive | Huntington Beach | 1964 | 07/15/2026 | 4 | 3 | 1,982 | 6,120 | $1.76M | $1.82M | $918 | 1.03 | 128 | 81 |
| 9331 CAPE COD Drive | Huntington Beach | 1964 | 05/12/2026 | 4 | 3 | 1,982 | 6,162 | $1.78M | $1.73M | $870 | 0.97 | 12 | 81 |
| 9162 Brabham Drive | Huntington Beach | 1969 | 10/22/2026 | 5 | 5 | 2,810 | 6,000 | $1.93M | $1.90M | $676 | 0.98 | 56 | 81 |
| Total: 5 · Average | 4.2 | 3.4 | 2,282.2 | 6,080.4 | $1.79M | $1.79M | $797.8 | — | 63 | ||||
| Median | 1,982 | $1.82M | $1.82M | ||||||||||
Market Analysis
List vs Sale $/SqFt
Sale Price Trend
Days on Market
Sale vs List Price
This analysis was generated automatically from MLS data. For an in-depth, human-reviewed valuation, contact Joseph Sardella at josephsardella@gmail.com.