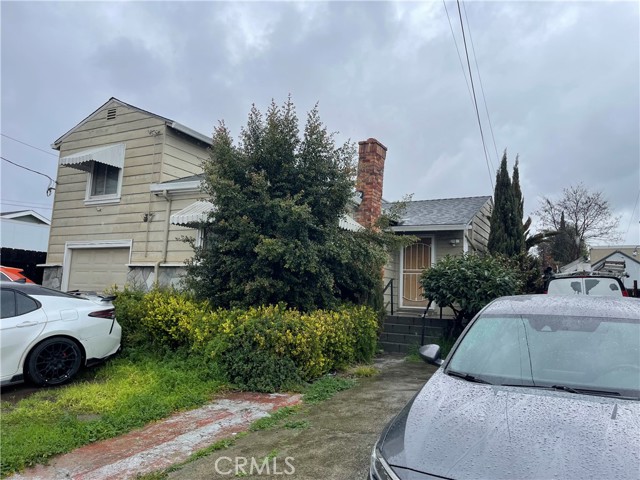
1 / 8
9220 Cherry, Oakland, CA 94603
$549K3bd · 2ba · 1,634 sqft
Lot 5,080 sqft•Single Family Residence•Active•264d on market•MLS# PW-26043859
9220 Cherry, Oakland, CA 94603
MLS# PW-26043859•Residential•Single Family Residence
Active264 days on market
$549,000
3
Beds
2
Baths
1,634
Sq Ft
5,080
Lot Sq Ft
1938
Year Built
None
View
Property Description
Charming 3-bedroom, 2-bath home in Oakland offering 1,634 sq ft of living space on a 5,080 sq ft lot. Features a spacious layout, great natural light, and a generous backyard perfect for relaxing or entertaining. Conveniently located near local amenities and commuter routes.
Features & Amenities
FeeBuilt 1938
Property Details
Land Type
Fee
Year Built
1938
Property Type
Residential
Property Subtype
Single Family Residence
Parking Spaces
1
Garage Spaces
1
Heating
Forced Air
Cooling
Central Air
View
None
City
Oakland
Zip Code
94603
County
Alameda
Mortgage Calculator
Current Rates
$
$
%
Monthly Payment
$2,776.04
Principal & Interest
Loan Amount
$439,200
Total Interest
$560,175
Total Payment Over 30 Years
$999,375
This calculator provides estimates only. Actual mortgage payments may include taxes, insurance, HOA fees, and PMI. Contact a lender for accurate quotes.
Comparative Market Analysis
Residential Tier · 5 active · 5 closed
9220 Cherry, Oakland, CA 94603
Oakland · Single Family Residence
$549K
Residential TierBeds
3
Baths
2
Sqft
1,634
Lot
5,080 sqft
Year
1938
$/Sqft
$336
Pool: No✓
View: None✓
Garage: 1-car✓
Listed in line with the median closed sale of $565,000. Price per sqft ($336) is a 24% discount to closed comps ($441). Closed comps sold at 103% of list — strong seller's market.
Price Position
Aligned with the market — fair pricing for the comps.
At market
Subject listed at $549K· $336/sqft
Total list price
Closed comps
vs closed median $565K
−$16K (−2.8%)
Active comps
vs active median $570K
−$21K (−3.7%)
Price per sqft
Closed compsinsufficient comp data
Active comps
vs active avg $/sqft $431
−$95 (−22.0%)
Active Properties (5)
Active Comparables
| Address | City | Year | BD | BTH | SqFt | LotSz | LP/SqFt | LP | DIM | Score |
|---|---|---|---|---|---|---|---|---|---|---|
| 8600 Seneca Street | Oakland | 1948 | 3 | 2 | 1,557 | 6,200 | $366 | $569,950 | 137 | 86 |
| 2735 Truman | Oakland | 1944 | 3 | 2 | 1,526 | 4,896 | $316 | $482,500 | 244 | 85 |
| 1916 98Th Ave | Oakland | 1906 | 3 | 2 | 1,351 | 6,250 | $433 | $585,000 | 18 | 79 |
| 1480 77Th Ave | Oakland | 1923 | 3 | 2 | 1,060 | 3,350 | $460 | $488,000 | 45 | 78 |
| 9943 Voltaire Ave | Oakland | 1940 | 3 | 2 | 984 | 3,800 | $579 | $569,800 | 8 | 76 |
| Total: 5 · Average | 3.0 | 2.0 | 1,295.6 | 4,899.2 | $430.8 | $539,050 | 90.4 | |||
| Median | 1,351 | $569,800 | ||||||||
Closed Properties (5)
Closed Comparables
| Address | City | Year | Date | BD | BTH | SqFt | LotSz | LP | SP | SP/SqFt | SP/LP | DIM | Score |
|---|---|---|---|---|---|---|---|---|---|---|---|---|---|
| 1937 98th AVE | Oakland | 1942 | 10/27/2026 | 3 | 2 | 1,708 | 5,000 | $625,000 | $615,000 | $360 | 0.98 | 112 | 89 |
| 1615 85Th Ave | Oakland | 1979 | 08/13/2026 | 3 | 2 | 1,627 | 5,300 | $545,000 | $565,000 | $347 | 1.04 | 167 | 88 |
| 9903 Olive St | Oakland | 1930 | 08/31/2026 | 3 | 2 | 1,195 | 3,327 | $515,000 | $515,000 | $431 | 1.00 | 105 | 84 |
| 1663 85Th Ave | Oakland | 1920 | 11/25/2025 | 3 | 2 | 1,320 | 5,320 | $489,900 | $525,000 | $398 | 1.07 | 31 | 83 |
| 1514 88Th Ave | Oakland | 1922 | 08/20/2026 | 3 | 2 | 926 | 3,960 | $599,000 | $620,000 | $670 | 1.03 | 38 | 82 |
| Total: 5 · Average | 3.0 | 2.0 | 1,355.2 | 4,581.4 | $568,000 | $568,000 | $441.2 | — | 90.6 | ||||
| Median | 1,320 | $565,000 | $565,000 | ||||||||||
Market Analysis
List vs Sale $/SqFt
Sale Price Trend
Days on Market
Sale vs List Price
AI-generated CMA
This analysis was generated automatically from MLS data. For an in-depth, human-reviewed valuation, contact Joseph Sardella at josephsardella@gmail.com.