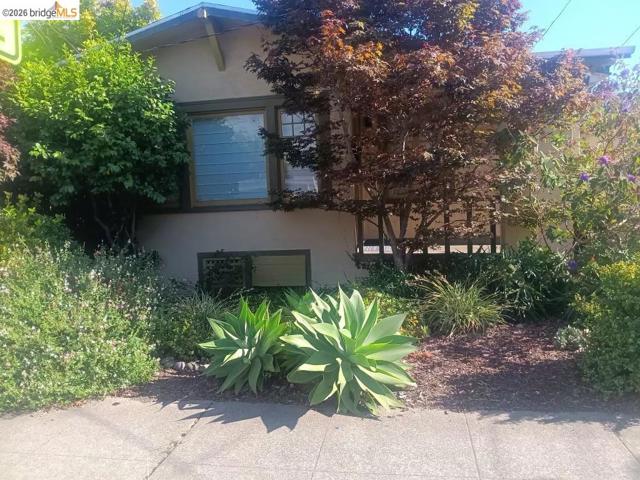
915 39Th St, Oakland, CA 94608
915 39Th St, Oakland, CA 94608
Property Description
North Oakland opportunity for home ownership. Old world Charm awaits you TLC will make this 3 bedroom 1+ bathroom home sparkle. There is a downstairs room that is ideal to create a large family room, rumpus room, workshop etc. The rear yard is a quaint getaway with it's maple trees and pleasant greenery.
Features & Amenities
Property Details
Mortgage Calculator
Current Rates
Comparative Market Analysis
Residential Tier · 5 active · 5 closed
Oakland · Single Family Residence
Listed 9.4% below the median closed sale of $705,000. Price per sqft ($409) is a 11% discount to closed comps ($462). Closed comps sold at 102% of list — strong seller's market.
Price Position
Priced below the market — value advantage over the field.
Active Properties (5)
Active Comparables
| Address | City | Year | BD | BTH | SqFt | LotSz | LP/SqFt | LP | DIM | Score |
|---|---|---|---|---|---|---|---|---|---|---|
| 2701 Chestnut St | Oakland | 1925 | 3 | 1 | 1,150 | 4,488 | $608 | $699,000 | 37 | 78 |
| 842 33Rd St | Oakland | 1908 | 2 | 1 | 1,107 | 3,235 | $631 | $699,000 | 9 | 77 |
| 3326 Chestnut St | Oakland | 1888 | 4 | 1 | 1,344 | 5,096 | $520 | $699,000 | 129 | 69 |
| 3414 Andover St | Oakland | 1903 | 3 | 1 | 1,320 | 6,000 | $492 | $649,000 | 30 | 68 |
| 553 29Th St | Oakland | 1885 | 4 | 2 | 2,188 | 4,290 | $269 | $589,000 | 2 | 67 |
| Total: 5 · Average | 3.2 | 1.2 | 1,421.8 | 4,621.8 | $504 | $667,000 | 41.4 | |||
| Median | 1,320 | $699,000 | ||||||||
Closed Properties (5)
Closed Comparables
| Address | City | Year | Date | BD | BTH | SqFt | LotSz | LP | SP | SP/SqFt | SP/LP | DIM | Score |
|---|---|---|---|---|---|---|---|---|---|---|---|---|---|
| 3239 Adeline St | Oakland | 1895 | 10/28/2026 | 3 | 2 | 1,523 | 2,952 | $599,000 | $705,000 | $463 | 1.18 | 27 | 84 |
| 716 39Th St | Oakland | 1908 | 02/27/2026 | 3 | 2 | 1,329 | 3,300 | $710,000 | $730,000 | $549 | 1.03 | 28 | 82 |
| 3608 Adeline St | Emeryville | 1911 | 05/08/2026 | 2 | 2 | 1,163 | 2,000 | $599,000 | $615,000 | $529 | 1.03 | 43 | 78 |
| 4326 West St | Oakland | 1911 | 04/29/2026 | 4 | 3 | 1,825 | 3,300 | $749,000 | $725,000 | $397 | 0.97 | 34 | 78 |
| 723 Apgar St | Oakland | 1965 | 11/21/2025 | 3 | 2 | 1,853 | 4,118 | $749,000 | $691,000 | $373 | 0.92 | 59 | 76 |
| Total: 5 · Average | 3.0 | 2.2 | 1,538.6 | 3,134 | $693,200 | $693,200 | $462.2 | — | 38.2 | ||||
| Median | 1,523 | $705,000 | $705,000 | ||||||||||
Market Analysis
List vs Sale $/SqFt
Sale Price Trend
Days on Market
Sale vs List Price
This analysis was generated automatically from MLS data. For an in-depth, human-reviewed valuation, contact Joseph Sardella at josephsardella@gmail.com.