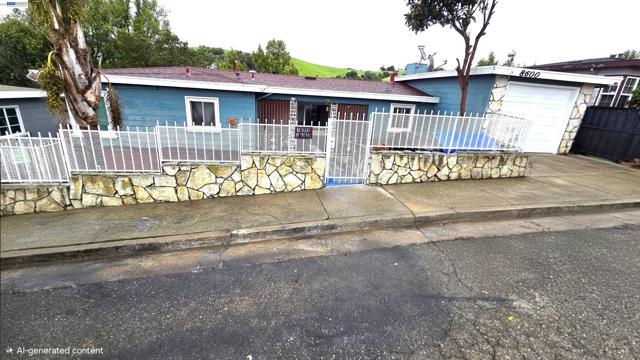
8600 Seneca Street, Oakland, CA 94605
8600 Seneca Street, Oakland, CA 94605
Property Description
A quiet area above MacAuthur and Bishop O Dowd school. Not on a thru street. This an opportunity to live in the upper unit and have your mortgage subsidized by the income from the ADU. Needs some cosmetic work. Has a one car garage for main unit. Home is rented at the new rental price of $1778.00/mo and the downstairs ADU rents out for $1795.00/mo ASK ABOUT SELLER CREDITS TO CLOSING COSTS
Features & Amenities
Property Details
Mortgage Calculator
Current Rates
Comparative Market Analysis
Residential Tier · 5 active · 5 closed
Oakland · Single Family Residence
Listed 5.0% below the median closed sale of $600,000. Price per sqft ($366) is a 16% discount to closed comps ($438).
Price Position
Priced below the market — value advantage over the field.
Active Properties (5)
Active Comparables
| Address | City | Year | BD | BTH | SqFt | LotSz | LP/SqFt | LP | DIM | Score |
|---|---|---|---|---|---|---|---|---|---|---|
| 9220 Cherry | Oakland | 1938 | 3 | 2 | 1,634 | 5,080 | $336 | $549,000 | 261 | 82 |
| 4117 Seacor Ct | Oakland | 1946 | 3 | 1 | 1,104 | 5,925 | $543 | $599,000 | 16 | 75 |
| 1916 98Th Ave | Oakland | 1906 | 3 | 2 | 1,351 | 6,250 | $433 | $585,000 | 18 | 75 |
| 2914 75th Ave | Oakland | 1931 | 3 | 2 | 1,758 | 3,800 | $341 | $599,000 | 10 | 75 |
| 2401 80th AVE | Oakland | 1939 | 4 | 3 | 1,866 | 3,850 | $348 | $650,000 | 104 | 72 |
| Total: 5 · Average | 3.2 | 2.0 | 1,542.6 | 4,981 | $400.2 | $596,400 | 81.8 | |||
| Median | 1,634 | $599,000 | ||||||||
Closed Properties (5)
Closed Comparables
| Address | City | Year | Date | BD | BTH | SqFt | LotSz | LP | SP | SP/SqFt | SP/LP | DIM | Score |
|---|---|---|---|---|---|---|---|---|---|---|---|---|---|
| 8809 Seneca Street | Oakland | 1941 | 06/15/2026 | 3 | 1 | 1,503 | 8,700 | $730,000 | $650,000 | $432 | 0.89 | 27 | 84 |
| 2250 83Rd Ave | Oakland | 1936 | 12/08/2025 | 3 | 2 | 1,325 | 5,320 | $520,000 | $520,000 | $392 | 1.00 | 53 | 81 |
| 2521 80th Ave | Oakland | 1930 | 03/03/2026 | 3 | 2 | 1,390 | 3,710 | $595,000 | $610,000 | $439 | 1.02 | 40 | 79 |
| 8342 Ney Avenue | Oakland | 1936 | 09/02/2026 | 3 | 1 | 1,331 | 3,960 | $599,000 | $600,000 | $451 | 1.00 | 49 | 77 |
| 2452 Casa Ct | Oakland | 2003 | 09/15/2026 | 3 | 2 | 1,177 | 2,540 | $560,000 | $560,000 | $476 | 1.00 | 40 | 76 |
| Total: 5 · Average | 3.0 | 1.6 | 1,345.2 | 4,846 | $588,000 | $588,000 | $438 | — | 41.8 | ||||
| Median | 1,331 | $600,000 | $600,000 | ||||||||||
Market Analysis
List vs Sale $/SqFt
Sale Price Trend
Days on Market
Sale vs List Price
This analysis was generated automatically from MLS data. For an in-depth, human-reviewed valuation, contact Joseph Sardella at josephsardella@gmail.com.