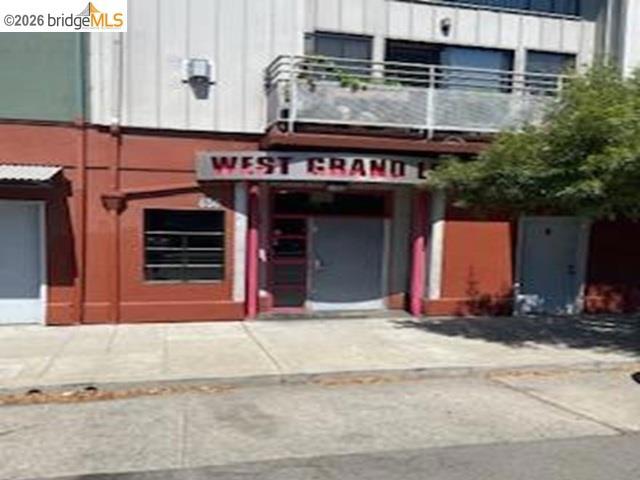
1 / 11
850 West Grand Ave, 17, Oakland, CA 94607
$560K1bd · 2ba · 1,613 sqft
Lot 11,929 sqft•HOA $754/mo•Condominium•Active•83d on market•MLS# 00-41146409
850 West Grand Ave, 17, Oakland, CA 94607
MLS# 00-41146409•Residential•Condominium
Active83 days on market
$559,900
1
Beds
2
Baths
1,613
Sq Ft
11,929
Lot Sq Ft
$754
HOA/mo
2003
Year Built
Property Description
This condo is a one bedroom loft , two bathrooms, 1613 sq ft end unit, balcony with city view, floor to ceiling windows , gas fireplace, ceiling skylight ,recessed lighting, updated kitchen, granite counters ,breakfast bar, stainless steel appliances, in unit laundry and parking .
Features & Amenities
FeeBuilt 2003
Property Details
Land Type
Fee
Year Built
2003
Property Type
Residential
Property Subtype
Condominium
Heating
Forced Air
Flooring
Concrete
City
Oakland
Zip Code
94607
County
Alameda
Mortgage Calculator
Current Rates
$
$
%
Monthly Payment
$2,831.16
Principal & Interest
Loan Amount
$447,920
Total Interest
$571,297
Total Payment Over 30 Years
$1,019,217
This calculator provides estimates only. Actual mortgage payments may include taxes, insurance, HOA fees, and PMI. Contact a lender for accurate quotes.
Comparative Market Analysis
Residential Tier · 5 active · 5 closed
850 West Grand Ave, 17, Oakland, CA 94607
Oakland · Condominium
$560K
Residential TierBeds
1
Baths
2
Sqft
1,613
Lot
11,929 sqft
Year
2003
$/Sqft
$347
Pool: No✓
View: city✓
Listed in line with the median closed sale of $550,000. Price per sqft ($347) is a 15% discount to closed comps ($409). Closed comps sold at 101% of list — strong seller's market.
Price Position
Aligned with the market — fair pricing for the comps.
At market
Subject listed at $560K· $347/sqft
Total list price
Closed comps
vs closed median $550K
+$10K (+1.8%)
Active comps
vs active median $499K
+$61K (+12.2%)
Price per sqft
Closed compsinsufficient comp data
Active comps
vs active avg $/sqft $498
−$151 (−30.3%)
Active Properties (5)
Active Comparables
| Address | City | Year | BD | BTH | SqFt | LotSz | LP/SqFt | LP | DIM | Score |
|---|---|---|---|---|---|---|---|---|---|---|
| 675 8th St | Oakland | 2002 | 2 | 2 | 993 | 9,216 | $498 | $495,000 | 58 | 78 |
| 3116 Adeline St | Oakland | 2004 | 1 | 2 | 957 | 20,844 | $521 | $499,000 | 2 | 71 |
| 1545 32nd Street | Oakland | 2023 | 2 | 2 | 1,078 | 0 | $445 | $480,000 | 31 | 70 |
| 1545 32nd Street | Oakland | 2023 | 2 | 2 | 1,151 | 0 | $469 | $539,900 | 116 | 69 |
| 585 9Th St | Oakland | 2008 | 2 | 2 | 990 | 23,942 | $555 | $549,000 | 94 | 69 |
| Total: 5 · Average | 1.8 | 2.0 | 1,033.8 | 18,000.667 | $497.6 | $512,580 | 60.2 | |||
| Median | 993 | $499,000 | ||||||||
Closed Properties (5)
Closed Comparables
| Address | City | Year | Date | BD | BTH | SqFt | LotSz | LP | SP | SP/SqFt | SP/LP | DIM | Score |
|---|---|---|---|---|---|---|---|---|---|---|---|---|---|
| 2300 Broadway | Oakland | 2006 | 05/12/2026 | 2 | 2 | 1,270 | 0 | $525,000 | $550,000 | $433 | 1.05 | 33 | 82 |
| 3206 Ettie St | Oakland | 2003 | 09/22/2026 | 2 | 2 | 1,640 | 6,200 | $636,300 | $636,300 | $388 | 1.00 | 0 | 77 |
| 2300 Broadway | Oakland | 2006 | 05/15/2026 | 2 | 2 | 1,160 | 11,373 | $498,000 | $498,000 | $429 | 1.00 | 71 | 75 |
| 2112 West St | Oakland | 1956 | 12/16/2025 | 2 | 2 | 1,648 | 7,689 | $599,000 | $590,000 | $358 | 0.98 | 214 | 74 |
| 2400 Adeline ST | Oakland | 2024 | 04/08/2026 | 2 | 2 | 1,148 | 0 | $499,000 | $499,000 | $435 | 1.00 | 137 | 71 |
| Total: 5 · Average | 2.0 | 2.0 | 1,373.2 | 8,420.667 | $554,660 | $554,660 | $408.6 | — | 91 | ||||
| Median | 1,270 | $550,000 | $550,000 | ||||||||||
Market Analysis
List vs Sale $/SqFt
Sale Price Trend
Days on Market
Sale vs List Price
AI-generated CMA
This analysis was generated automatically from MLS data. For an in-depth, human-reviewed valuation, contact Joseph Sardella at josephsardella@gmail.com.