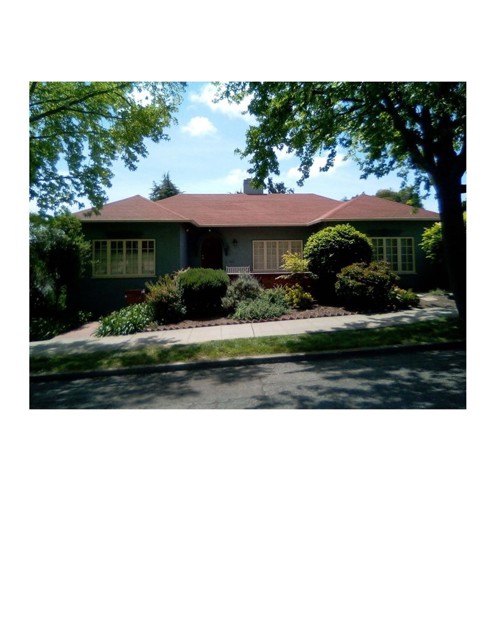
1 / 15
845 Prospect, Oakland, CA 94610
$1.6M2bd · 2ba · 1,591 sqft
Lot 5,280 sqft•Single Family Residence•Active•14d on market•MLS# SW-26237715
845 Prospect, Oakland, CA 94610
MLS# SW-26237715•Residential•Single Family Residence
Active14 days on market
$1,600,000
2
Beds
2
Baths
1,591
Sq Ft
5,280
Lot Sq Ft
1926
Year Built
None
View
Property Description
The listed price is firm, no price discount and no seller concession's.
Features & Amenities
FeeBuilt 1926
Property Details
Land Type
Fee
Year Built
1926
Property Type
Residential
Property Subtype
Single Family Residence
Parking Spaces
2
Garage Spaces
2
Cooling
None
View
None
City
Oakland
Zip Code
94610
County
Alameda
Mortgage Calculator
Current Rates
$
$
%
Monthly Payment
$8,090.47
Principal & Interest
Loan Amount
$1,280,000
Total Interest
$1,632,569
Total Payment Over 30 Years
$2,912,569
This calculator provides estimates only. Actual mortgage payments may include taxes, insurance, HOA fees, and PMI. Contact a lender for accurate quotes.
Comparative Market Analysis
Luxury Tier · 5 active · 5 closed
845 Prospect, Oakland, CA 94610
Oakland · Single Family Residence
$1.6M
Luxury TierBeds
2
Baths
2
Sqft
1,591
Lot
5,280 sqft
Year
1926
$/Sqft
$1006
Pool: No✓
View: None✓
Garage: 2-car✓
Listed 13.1% above the median closed sale of $1,415,000. Price per sqft ($1,006) is a 16% premium to closed comps ($865). Closed comps sold at 133% of list — strong seller's market. Luxury tier — fewer comparable sales widen the confidence range.
Price Position
Positioned above the market — commands a premium.
Premium
Subject listed at $1.60M· $1,006/sqft
Total list price
Closed comps
vs closed median $1.42M
+$185K (+13.1%)
Active comps
vs active median $1.69M
−$90K (−5.3%)
Price per sqft
Closed compsinsufficient comp data
Active comps
vs active avg $/sqft $563
+$443 (+78.7%)
Active Properties (5)
Active Comparables
| Address | City | Year | BD | BTH | SqFt | LotSz | LP/SqFt | LP | DIM | Score |
|---|---|---|---|---|---|---|---|---|---|---|
| 4440 Howe St | Oakland | 1896 | 4 | 3 | 1,927 | 3,275 | $880 | $1.70M | 85 | 56 |
| 2554 West St | Oakland | 1946 | 1 | 2 | 4,635 | 3,021 | $301 | $1.40M | 48 | 42 |
| 486 Rich Street | Oakland | 1915 | 4 | 5 | 2,733 | 3,400 | $540 | $1.48M | 25 | 42 |
| 3 Jouett Sq | Alameda | 2006 | 4 | 3 | 3,179 | 3,712 | $550 | $1.75M | 10 | 33 |
| 6153 Girvin Drive | Oakland | 2001 | 4 | 5 | 3,108 | 9,511 | $544 | $1.69M | 66 | 20 |
| Total: 5 · Average | 3.4 | 3.6 | 3,116.4 | 4,583.8 | $563 | $1.60M | 46.8 | |||
| Median | 3,108 | $1.69M | ||||||||
Closed Properties (5)
Closed Comparables
| Address | City | Year | Date | BD | BTH | SqFt | LotSz | LP | SP | SP/SqFt | SP/LP | DIM | Score |
|---|---|---|---|---|---|---|---|---|---|---|---|---|---|
| 820 Prospect Ave | Oakland | 1921 | 10/09/2026 | 3 | 2 | 1,405 | 5,500 | $998,000 | $1.48M | $1,053 | 1.48 | 28 | 88 |
| 905 Alma Pl | Oakland | 1927 | 01/06/2026 | 3 | 2 | 1,678 | 4,100 | $1.09M | $1.38M | $821 | 1.27 | 44 | 85 |
| 528 Haddon Rd | Oakland | 1910 | 08/07/2026 | 4 | 2 | 2,068 | 5,200 | $995,000 | $1.48M | $713 | 1.48 | 23 | 79 |
| 859 Sunnyhills Rd | Oakland | 1925 | 06/25/2026 | 3 | 1 | 1,354 | 6,321 | $1.35M | $1.42M | $1,045 | 1.05 | 35 | 78 |
| 661 Brookwood Pl | Oakland | 1922 | 07/27/2026 | 3 | 3 | 1,987 | 4,000 | $995,000 | $1.38M | $695 | 1.39 | 31 | 76 |
| Total: 5 · Average | 3.2 | 2.0 | 1,698.4 | 5,024.2 | $1.43M | $1.43M | $865.4 | — | 32.2 | ||||
| Median | 1,678 | $1.42M | $1.42M | ||||||||||
Market Analysis
List vs Sale $/SqFt
Sale Price Trend
Days on Market
Sale vs List Price
AI-generated CMA
This analysis was generated automatically from MLS data. For an in-depth, human-reviewed valuation, contact Joseph Sardella at josephsardella@gmail.com.