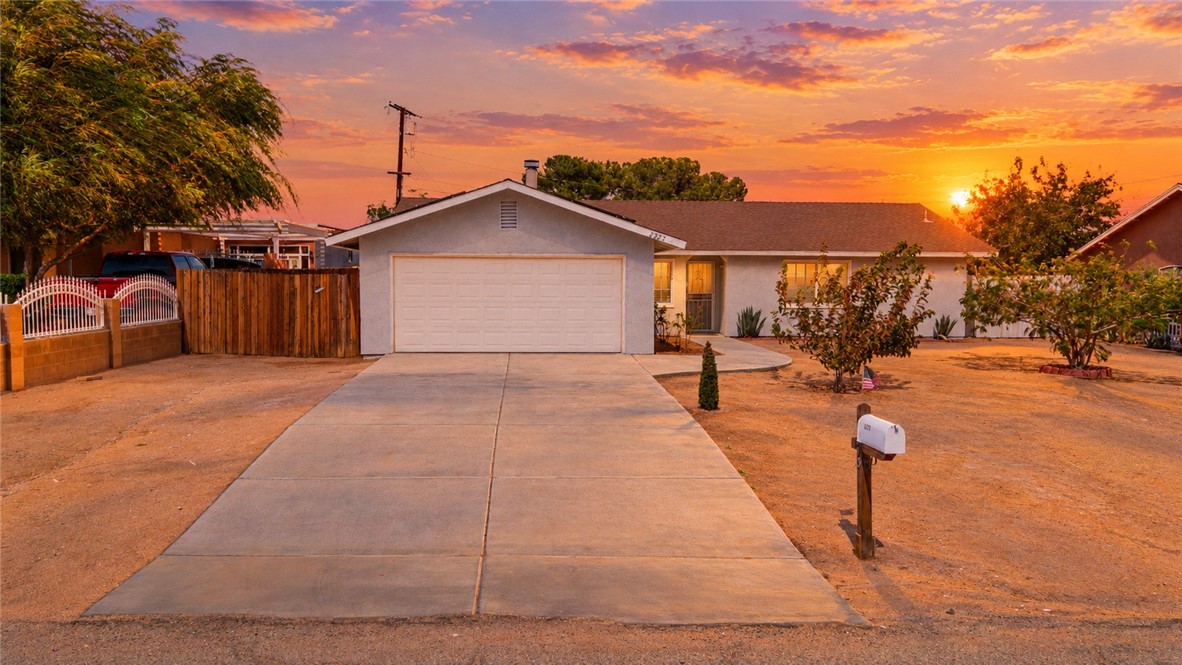
8373 Ironwood, California City, CA 93505
8373 Ironwood, California City, CA 93505
Property Description
Fully renovated, move-in ready, and packed with value! This beautifully updated 3-bedroom home features a brand-new kitchen, completely renovated bathrooms, new flooring throughout, and modern updates that make this one easy to love. The septic tank has already been certified, and the home is equipped with solar through a lease. Whether you're a first-time buyer looking for a turnkey home or an investor searching for a low-maintenance addition to your portfolio, this property checks the boxes. Skip the major renovation projects and move straight into a home that's already been updated and ready for its next owner!
Features & Amenities
Property Details
Mortgage Calculator
Current Rates
Comparative Market Analysis
Affordable Tier · 5 active · 5 closed
California City · Single Family Residence
Listed in line with the median closed sale of $315,000. Closed comps sold at 101% of list — strong seller's market.
Price Position
Aligned with the market — fair pricing for the comps.
Active Properties (5)
Active Comparables
| Address | City | Year | BD | BTH | SqFt | LotSz | LP/SqFt | LP | DIM | Score |
|---|---|---|---|---|---|---|---|---|---|---|
| 8560 Eucalyptus | California City | 2007 | 3 | 2 | 1,556 | 9,994 | $183 | $285,500 | 46 | 93 |
| 20313 Corwin Street | California City | 2007 | 3 | 2 | 1,368 | 10,394 | $230 | $314,900 | 86 | 88 |
| 9020 Redwood Boulevard | California City | 1994 | 3 | 2 | 1,531 | 10,041 | $195 | $299,000 | 27 | 87 |
| 20325 Airway | California City | 1988 | 3 | 2 | 1,743 | 10,845 | $155 | $270,000 | 80 | 85 |
| 8801 Hickory | California City | 1989 | 3 | 2 | 1,714 | 11,326 | $181 | $310,000 | 167 | 82 |
| Total: 5 · Average | 3.0 | 2.0 | 1,582.4 | 10,520 | $188.8 | $295,880 | 81.2 | |||
| Median | 1,556 | $299,000 | ||||||||
Closed Properties (5)
Closed Comparables
| Address | City | Year | Date | BD | BTH | SqFt | LotSz | LP | SP | SP/SqFt | SP/LP | DIM | Score |
|---|---|---|---|---|---|---|---|---|---|---|---|---|---|
| 20548 Medio Street | California City | 2026 | 10/16/2026 | 3 | 2 | 1,629 | 9,789 | $339,900 | $341,000 | $209 | 1.00 | 101 | 90 |
| 20312 Graham Street | California City | 1990 | 06/09/2026 | 3 | 2 | 1,514 | 10,019 | $310,000 | $315,000 | $208 | 1.02 | 47 | 88 |
| 20649 83rd Street | California City | 1988 | 06/22/2026 | 3 | 2 | 1,603 | 10,454 | $299,990 | $291,990 | $182 | 0.97 | 32 | 87 |
| 20548 Neuralia Road | California City | 1984 | 11/09/2026 | 3 | 2 | 1,450 | 10,454 | $290,000 | $300,000 | $207 | 1.03 | 140 | 86 |
| 8213 Peach Avenue | California City | 2026 | 06/18/2026 | 3 | 2 | 1,629 | 9,045 | $334,900 | $339,000 | $208 | 1.01 | 91 | 85 |
| Total: 5 · Average | 3.0 | 2.0 | 1,565 | 9,952.2 | $317,398 | $317,398 | $202.8 | — | 82.2 | ||||
| Median | 1,603 | $315,000 | $315,000 | ||||||||||
Market Analysis
List vs Sale $/SqFt
Sale Price Trend
Days on Market
Sale vs List Price
This analysis was generated automatically from MLS data. For an in-depth, human-reviewed valuation, contact Joseph Sardella at josephsardella@gmail.com.