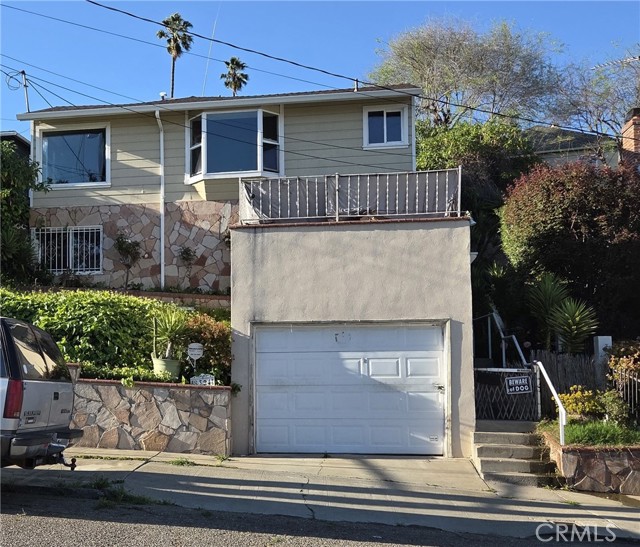
8354 Ney, Oakland, CA 94605
8354 Ney, Oakland, CA 94605
Property Description
Updated Oakland Hills home offering flexible living and city views. Light-filled living room features hardwood floors, crown molding, recessed lighting, and fireplace. Updated kitchen with granite counters, stainless steel appliances, gas range, and ample cabinetry. Dining area includes picture window and built-in seating. Upstairs offers spacious bedrooms and updated bath with modern finishes. Lower level includes separate 1BD/1BA bonus space ideal for in-law, guests, office, or potential income. Outdoor spaces include tiered decking and rooftop deck with city and territorial views—perfect for entertaining. Additional features: dual-pane windows, laundry area, forced air heating, and attached 1-car garage. Convenient location with access to freeways, parks, and amenities.
Features & Amenities
Property Details
Mortgage Calculator
Current Rates
Comparative Market Analysis
Affordable Tier · 5 active · 5 closed
Oakland · Single Family Residence
Listed 12.7% above the median closed sale of $620,000. Closed comps sold at 113% of list — strong seller's market.
Price Position
Positioned above the market — commands a premium.
Active Properties (5)
Active Comparables
| Address | City | Year | BD | BTH | SqFt | LotSz | LP/SqFt | LP | DIM | Score |
|---|---|---|---|---|---|---|---|---|---|---|
| 2515 Oliver Ave | Oakland | 1959 | 3 | 2 | 1,352 | 3,000 | $499 | $675,000 | 61 | 76 |
| 234 Kerwin Ave | Oakland | 1943 | 3 | 2 | 1,416 | 4,056 | $459 | $650,000 | 4 | 75 |
| 9108 Golf Links | Oakland | 1973 | 4 | 2 | 1,572 | 4,280 | $419 | $659,000 | 165 | 73 |
| 2914 75th Ave | Oakland | 1931 | 3 | 2 | 1,758 | 3,800 | $341 | $599,000 | 10 | 71 |
| 3301 82nd Ave | Oakland | 1940 | 2 | 1 | 946 | 2,925 | $629 | $595,000 | 32 | 69 |
| Total: 5 · Average | 3.0 | 1.8 | 1,408.8 | 3,612.2 | $469.4 | $635,600 | 54.4 | |||
| Median | 1,416 | $650,000 | ||||||||
Closed Properties (5)
Closed Comparables
| Address | City | Year | Date | BD | BTH | SqFt | LotSz | LP | SP | SP/SqFt | SP/LP | DIM | Score |
|---|---|---|---|---|---|---|---|---|---|---|---|---|---|
| 1720 Auseon Ave | Oakland | 1924 | 05/05/2026 | 3 | 2 | 1,790 | 4,000 | $679,000 | $725,000 | $405 | 1.07 | 26 | 77 |
| 1514 88Th Ave | Oakland | 1922 | 08/20/2026 | 3 | 2 | 926 | 3,960 | $599,000 | $620,000 | $670 | 1.03 | 38 | 74 |
| 1612 94Th Ave | Oakland | 1924 | 02/24/2026 | 3 | 3 | 1,349 | 3,498 | $487,000 | $610,000 | $452 | 1.25 | 46 | 71 |
| 9034 Birch St | Oakland | 1950 | 08/13/2026 | 5 | 3 | 2,332 | 4,500 | $649,950 | $720,000 | $309 | 1.11 | 35 | 70 |
| 1927 83Rd Ave | Oakland | 1910 | 06/10/2026 | 3 | 2 | 1,040 | 5,400 | $498,000 | $600,000 | $577 | 1.21 | 35 | 70 |
| Total: 5 · Average | 3.4 | 2.4 | 1,487.4 | 4,271.6 | $655,000 | $655,000 | $482.6 | — | 36 | ||||
| Median | 1,349 | $620,000 | $620,000 | ||||||||||
Market Analysis
List vs Sale $/SqFt
Sale Price Trend
Days on Market
Sale vs List Price
This analysis was generated automatically from MLS data. For an in-depth, human-reviewed valuation, contact Joseph Sardella at josephsardella@gmail.com.