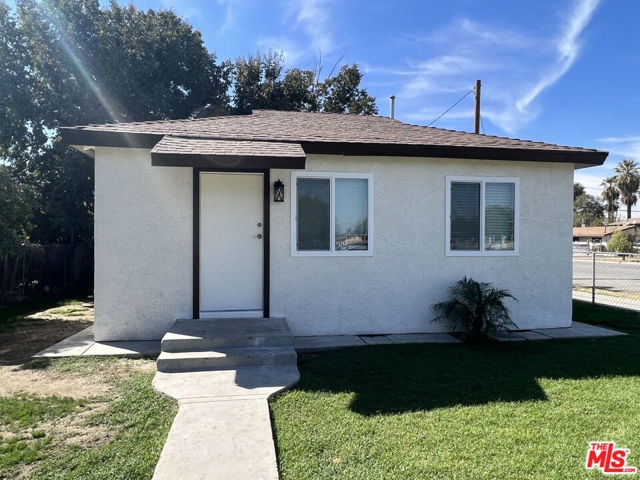
831 L Street, Bakersfield, CA 93304
831 L Street, Bakersfield, CA 93304
Property Description
Welcome to 831 L St., an R-3 lot zoning with a very well-maintained 2-bedroom, 1-bath home nestled in the historic Oleander-Sunset area. Offering new, updated interiors and a comfortable layout, this home is a great opportunity for both homebuyers and investors looking for a property with character and potential. Conveniently located near Downtown, you'll enjoy easy access to local shops, dining, entertainment, and everyday amenities. With its cared-for condition, new interiors, and desirable location, 831 L St. is a home worth taking a closer look at. Reach out to Mia the listing agent directly for a showing.
Features & Amenities
Property Details
Mortgage Calculator
Current Rates
Comparative Market Analysis
Affordable Tier · 5 active · 5 closed
Bakersfield · Single Family Residence
Listed 3.5% above the median closed sale of $230,000. Price per sqft ($413) is a 61% premium to closed comps ($257).
Price Position
Aligned with the market — fair pricing for the comps.
Active Properties (5)
Active Comparables
| Address | City | Year | BD | BTH | SqFt | LotSz | LP/SqFt | LP | DIM | Score |
|---|---|---|---|---|---|---|---|---|---|---|
| 1006 6th | Bakersfield | 1926 | 2 | 1 | 645 | 3,542 | $364 | $235,000 | 18 | 86 |
| 1512 Southgate Drive | Bakersfield | 1947 | 3 | 1 | 636 | 7,701 | $392 | $249,500 | 27 | 72 |
| 1512 Southgate Drive | Bakersfield | 1947 | 3 | 1 | 636 | 7,701 | $392 | $249,500 | 30 | 70 |
| 1026 Height | Bakersfield | 1946 | 2 | 1 | 750 | 6,473 | $353 | $265,000 | 7 | 61 |
| 612 Townsley | Bakersfield | 1950 | 3 | 1 | 1,257 | 6,088 | $215 | $269,999 | 106 | 55 |
| Total: 5 · Average | 2.6 | 1.0 | 784.8 | 6,301 | $343.2 | $253,799.8 | 37.6 | |||
| Median | 645 | $249,500 | ||||||||
Closed Properties (5)
Closed Comparables
| Address | City | Year | Date | BD | BTH | SqFt | LotSz | LP | SP | SP/SqFt | SP/LP | DIM | Score |
|---|---|---|---|---|---|---|---|---|---|---|---|---|---|
| 221 Wood | Bakersfield | 1954 | 12/12/2025 | 2 | 2 | 576 | 7,467 | $215,000 | $212,600 | $369 | 0.99 | 45 | 76 |
| 514 L | Bakersfield | 1938 | 09/04/2026 | 2 | 1 | 892 | 5,957 | $200,000 | $205,000 | $230 | 1.02 | 108 | 74 |
| 508 El Prado | Bakersfield | 1940 | 08/19/2026 | 2 | 1 | 992 | 6,598 | $254,800 | $245,000 | $247 | 0.96 | 119 | 60 |
| 1013 Delfino | Bakersfield | 1951 | 10/02/2026 | 3 | 2 | 898 | 5,107 | $260,000 | $260,000 | $290 | 1.00 | 44 | 59 |
| 1307 M | Bakersfield | 1921 | 11/12/2026 | 3 | 1 | 1,562 | 7,120 | $259,900 | $230,000 | $147 | 0.89 | 164 | 57 |
| Total: 5 · Average | 2.4 | 1.4 | 984 | 6,449.8 | $230,520 | $230,520 | $256.6 | — | 96 | ||||
| Median | 898 | $230,000 | $230,000 | ||||||||||
Market Analysis
List vs Sale $/SqFt
Sale Price Trend
Days on Market
Sale vs List Price
This analysis was generated automatically from MLS data. For an in-depth, human-reviewed valuation, contact Joseph Sardella at josephsardella@gmail.com.