823 North Delancey Ave, San Dimas, CA 91773
823 North Delancey Ave, San Dimas, CA 91773
Property Description
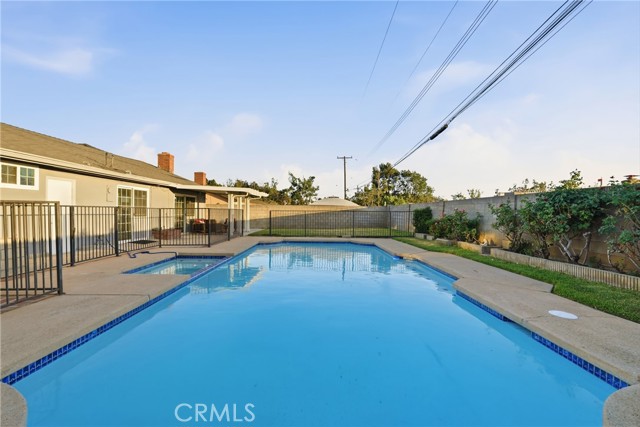
Charming single-story pool home in the heart of San Dimas, priced to reflect recent capital improvements! This 4-bedroom, 2-bathroom house spans 1,484 sq ft on a spacious 7,899 sq ft lot and has been extensively refreshed inside and out. Located in the award-winning Bonita Unified School District. Recent upgrades include a new A/C system, fresh interior and exterior paint, new luxury vinyl flooring throughout, and repaired stucco with replaced wood trim. Step through the double doors into a bright, open living and dining area, then out back to your private oasis, a newly resurfaced and replastered pool with a covered patio, mature landscaping, and a fully block-walled yard for privacy. The kitchen offers abundant oak cabinetry and a functional layout ready for a buyer's personal touch. A dedicated home office/den off the entry adds flexible living space. Smoke and carbon monoxide detectors have been installed throughout. Move-in ready with major systems and cosmetics already handled. Welcome home!
Features & Amenities
Property Details
Mortgage Calculator
Current Rates
Comparative Market Analysis
Affordable Tier · 5 active · 5 closed
San Dimas · Single Family Residence
Listed in line with the median closed sale of $880,000. Closed comps sold at 102% of list — strong seller's market.
Price Position
Aligned with the market — fair pricing for the comps.
Active Properties (5)
Active Comparables
| Address | City | Year | BD | BTH | SqFt | LotSz | LP/SqFt | LP | DIM | Score |
|---|---|---|---|---|---|---|---|---|---|---|
| 743 Churchill | San Dimas | 1963 | 3 | 2 | 1,473 | 7,716 | $645 | $949,999 | 31 | 92 |
| 554 Allen Avenue | San Dimas | 1963 | 4 | 2 | 1,538 | 8,034 | $536 | $825,000 | 3 | 91 |
| 553 Bellgrove Street | San Dimas | 1964 | 4 | 2 | 1,547 | 7,390 | $598 | $924,950 | 27 | 88 |
| 318 Gladstone | San Dimas | 1962 | 3 | 2 | 1,633 | 7,431 | $520 | $849,900 | 27 | 87 |
| 520 Lyford | La Verne | 1964 | 3 | 2 | 1,535 | 7,392 | $596 | $915,000 | 4 | 86 |
| Total: 5 · Average | 3.4 | 2.0 | 1,545.2 | 7,592.6 | $579 | $892,969.8 | 18.4 | |||
| Median | 1,538 | $915,000 | ||||||||
Closed Properties (5)
Closed Comparables
| Address | City | Year | Date | BD | BTH | SqFt | LotSz | LP | SP | SP/SqFt | SP/LP | DIM | Score |
|---|---|---|---|---|---|---|---|---|---|---|---|---|---|
| 819 Shaftesbury Avenue | San Dimas | 1963 | 07/08/2026 | 3 | 2 | 1,464 | 7,999 | $897,000 | $900,000 | $615 | 1.00 | 154 | 91 |
| 832 Pershore Avenue | San Dimas | 1963 | 05/13/2026 | 4 | 2 | 1,484 | 8,091 | $868,000 | $880,000 | $593 | 1.01 | 35 | 90 |
| 437 Portola | San Dimas | 1964 | 09/16/2026 | 4 | 2 | 1,638 | 7,514 | $799,000 | $835,000 | $510 | 1.04 | 39 | 89 |
| 751 Churchill | San Dimas | 1963 | 01/21/2026 | 4 | 2 | 1,473 | 7,930 | $899,000 | $906,000 | $615 | 1.01 | 27 | 89 |
| 619 PERSHORE Avenue | San Dimas | 1962 | 06/26/2026 | 3 | 2 | 1,425 | 7,515 | $848,000 | $880,000 | $618 | 1.04 | 30 | 87 |
| Total: 5 · Average | 3.6 | 2.0 | 1,496.8 | 7,809.8 | $880,200 | $880,200 | $590.2 | — | 57 | ||||
| Median | 1,473 | $880,000 | $880,000 | ||||||||||
Market Analysis
List vs Sale $/SqFt
Sale Price Trend
Days on Market
Sale vs List Price
This analysis was generated automatically from MLS data. For an in-depth, human-reviewed valuation, contact Joseph Sardella at josephsardella@gmail.com.