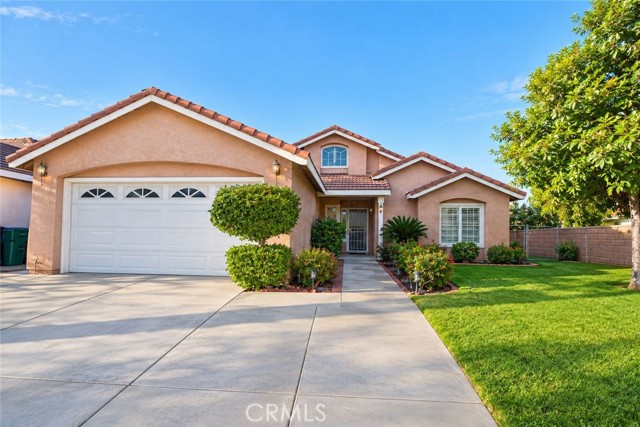
80486 Suncastle Rd, Indio, CA 92201
80486 Suncastle Rd, Indio, CA 92201
Property Description
Welcome to this beautiful 4-bedroom, 2-bathroom corner-lot home featuring soaring vaulted ceilings, a spacious floor plan, and an attached 2-car garage. The home offers a well-appointed kitchen with quality appliances, ceiling fans, and updated lighting throughout. Step outside to enjoy a lush, tropical-inspired backyard and side yard filled with mature fruit trees, including grapefruit, tangerine, papaya, lemon, and sugar apple. This inviting property offers the perfect blend of comfort, charm, and outdoor living. A wonderful opportunity you won't want to miss!
Features & Amenities
Property Details
Mortgage Calculator
Current Rates
Comparative Market Analysis
Affordable Tier · 5 active · 5 closed
Indio · Single Family Residence
Listed 5.3% below the median closed sale of $495,000. Price per sqft ($293) is a 12% discount to closed comps ($333).
Price Position
Priced below the market — value advantage over the field.
Active Properties (5)
Active Comparables
| Address | City | Year | BD | BTH | SqFt | LotSz | LP/SqFt | LP | DIM | Score |
|---|---|---|---|---|---|---|---|---|---|---|
| 80469 Sandscript Court | Indio | 1993 | 3 | 2 | 1,401 | 6,098 | $375 | $525,000 | 104 | 89 |
| 80205 Royal Birkdale Drive | Indio | 1998 | 2 | 2 | 1,707 | 5,915 | $243 | $415,000 | 12 | 83 |
| 46293 Willow Lane | Indio | 1998 | 5 | 3 | 1,971 | 6,534 | $236 | $465,000 | 25 | 81 |
| 44719 Alexandria Vale | Indio | 2002 | 2 | 2 | 1,764 | 5,227 | $249 | $439,000 | 67 | 81 |
| 80385 Green Hills Drive | Indio | 2002 | 2 | 3 | 1,703 | 5,227 | $311 | $530,000 | 44 | 80 |
| Total: 5 · Average | 2.8 | 2.4 | 1,709.2 | 5,800.2 | $282.8 | $474,800 | 50.4 | |||
| Median | 1,707 | $465,000 | ||||||||
Closed Properties (5)
Closed Comparables
| Address | City | Year | Date | BD | BTH | SqFt | LotSz | LP | SP | SP/SqFt | SP/LP | DIM | Score |
|---|---|---|---|---|---|---|---|---|---|---|---|---|---|
| 45558 Indian River Road | Indio | 1989 | 10/29/2026 | 4 | 2 | 1,590 | 6,970 | $499,000 | $504,000 | $317 | 1.01 | 65 | 92 |
| 80940 Granby Avenue | Indio | 1988 | 10/06/2026 | 4 | 2 | 1,460 | 8,712 | $514,900 | $495,000 | $339 | 0.96 | 42 | 88 |
| 80748 Cottonwood | Indio | 1994 | 08/13/2026 | 3 | 2 | 1,424 | 7,405 | $514,999 | $505,000 | $355 | 0.98 | 48 | 86 |
| 46482 Jasmine | Indio | 1989 | 06/18/2026 | 3 | 2 | 1,475 | 13,929 | $499,000 | $465,000 | $315 | 0.93 | 116 | 85 |
| 80847 Dartmouth Avenue | Indio | 1980 | 09/01/2026 | 3 | 2 | 1,291 | 7,405 | $425,000 | $435,000 | $337 | 1.02 | 53 | 82 |
| Total: 5 · Average | 3.4 | 2.0 | 1,448 | 8,884.2 | $480,800 | $480,800 | $332.6 | — | 64.8 | ||||
| Median | 1,460 | $495,000 | $495,000 | ||||||||||
Market Analysis
List vs Sale $/SqFt
Sale Price Trend
Days on Market
Sale vs List Price
This analysis was generated automatically from MLS data. For an in-depth, human-reviewed valuation, contact Joseph Sardella at josephsardella@gmail.com.