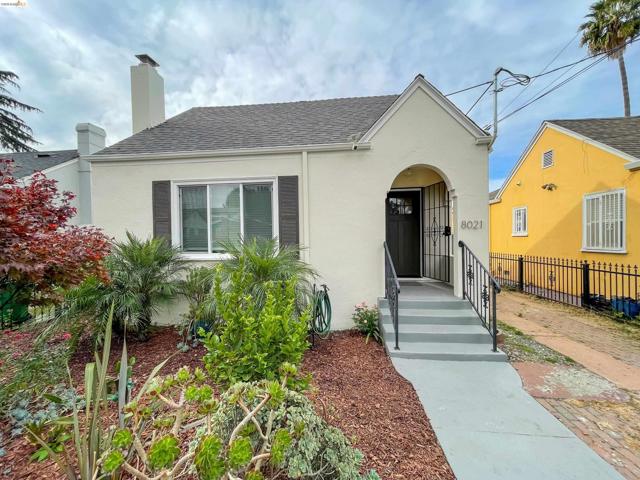
8021 Hillside St, Oakland, CA 94605
8021 Hillside St, Oakland, CA 94605
Property Description
Charming Oakland Starter Home with Turnkey Bonus Backyard Suite! Welcome to 8021 Hillside St, a versatile 2 bedroom, 1 bath single family home offering comfort, character, and exceptional income or flex space potential. The light filled main house features an inviting layout, functional living space, and a beautiful private low maintenance front and back yard with fruit trees. Bonus Feature: Step outside to discover a fully connected backyard trailer complete with dedicated water and sewer hookups. Perfect for a guest suite, remote home office, creative studio, or rental unit to offset your monthly mortgage. Conveniently located near I-580 and public transit, schools, restaurants, this move in ready property offers the space and flexibility modern East Bay buyers are searching for.
Features & Amenities
Property Details
Mortgage Calculator
Current Rates
Comparative Market Analysis
Affordable Tier · 5 active · 5 closed
Oakland · Single Family Residence
Listed 8.0% above the median closed sale of $490,000. Closed comps sold at 102% of list — strong seller's market.
Price Position
Positioned above the market — commands a premium.
Active Properties (5)
Active Comparables
| Address | City | Year | BD | BTH | SqFt | LotSz | LP/SqFt | LP | DIM | Score |
|---|---|---|---|---|---|---|---|---|---|---|
| 2333 81St Ave | Oakland | 1926 | 2 | 1 | 1,066 | 4,032 | $422 | $449,999 | 116 | 92 |
| 3301 82nd Ave | Oakland | 1940 | 2 | 1 | 946 | 2,925 | $629 | $595,000 | 32 | 88 |
| 7650 Ney Ave | Oakland | 1929 | 3 | 1 | 1,267 | 3,300 | $446 | $565,000 | 31 | 82 |
| 2914 75th Ave | Oakland | 1931 | 3 | 2 | 1,758 | 3,800 | $341 | $599,000 | 10 | 66 |
| 8600 Seneca Street | Oakland | 1948 | 3 | 2 | 1,557 | 6,200 | $366 | $569,950 | 137 | 61 |
| Total: 5 · Average | 2.6 | 1.4 | 1,318.8 | 4,051.4 | $440.8 | $555,789.8 | 65.2 | |||
| Median | 1,267 | $569,950 | ||||||||
Closed Properties (5)
Closed Comparables
| Address | City | Year | Date | BD | BTH | SqFt | LotSz | LP | SP | SP/SqFt | SP/LP | DIM | Score |
|---|---|---|---|---|---|---|---|---|---|---|---|---|---|
| 2000 82nd | Oakland | 1924 | 07/17/2026 | 2 | 1 | 1,022 | 2,948 | $489,777 | $487,700 | $477 | 1.00 | 106 | 93 |
| 2517 79th Ave | Oakland | 1926 | 08/14/2026 | 2 | 1 | 836 | 2,500 | $429,000 | $460,000 | $550 | 1.07 | 28 | 89 |
| 7700 Garfield Ave. | Oakland | 1930 | 05/18/2026 | 4 | 1 | 996 | 2,500 | $499,000 | $500,000 | $502 | 1.00 | 68 | 83 |
| 2648 77Th Ave | Oakland | 1924 | 04/30/2026 | 3 | 2 | 1,078 | 3,500 | $567,000 | $599,500 | $556 | 1.06 | 6 | 83 |
| 2640 77th Ave | Oakland | 1946 | 11/24/2025 | 2 | 1 | 1,198 | 3,500 | $499,000 | $490,000 | $409 | 0.98 | 91 | 78 |
| Total: 5 · Average | 2.6 | 1.2 | 1,026 | 2,989.6 | $507,440 | $507,440 | $498.8 | — | 59.8 | ||||
| Median | 1,022 | $490,000 | $490,000 | ||||||||||
Market Analysis
List vs Sale $/SqFt
Sale Price Trend
Days on Market
Sale vs List Price
This analysis was generated automatically from MLS data. For an in-depth, human-reviewed valuation, contact Joseph Sardella at josephsardella@gmail.com.