8011 Sunkist Dr, Oakland, CA 94605
8011 Sunkist Dr, Oakland, CA 94605
Property Description
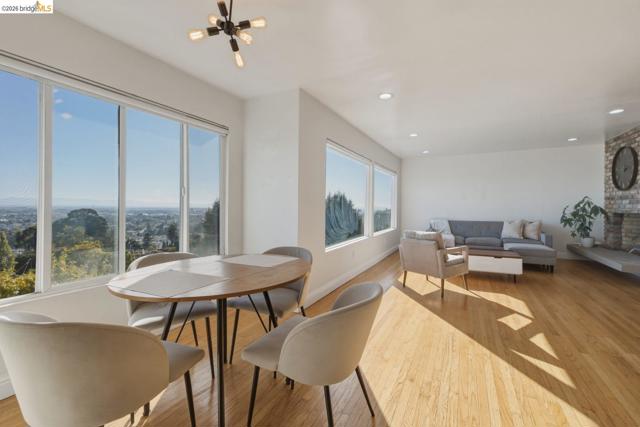
Stunning City Views in Eastmont Hills! Welcome to 8011 Sunkist Drive, a spacious four bedroom, three bathroom Eastmont Hills home offering 2,400 square feet of living space on a 10,087 square foot lot. Large windows showcase amazing city views, while hardwood floors and a brick wood- burning fireplace create a warm and inviting living area. The kitchen features an eat in area and flows seamlessly into a formal dining space, ideal for everyday living and entertaining. The upper level includes a main suite, two additional bedrooms, and a full bathroom. On the lower level, a separate rear-deck entrance leads to a junior suite, family room, and office, offering flexible space for guests, work, recreation, extended living or possible ADU. Whether you are looking for a place to call home or an investment opportunity, comer see the possibilities at 8011 Sunkist Drive!
Features & Amenities
Property Details
Mortgage Calculator
Current Rates
Comparative Market Analysis
Residential Tier · 5 active · 5 closed
Oakland · Single Family Residence
Listed in line with the median closed sale of $835,000. Price per sqft ($375) is a 15% discount to closed comps ($443). Closed comps sold at 102% of list — strong seller's market.
Price Position
Aligned with the market — fair pricing for the comps.
Active Properties (5)
Active Comparables
| Address | City | Year | BD | BTH | SqFt | LotSz | LP/SqFt | LP | DIM | Score |
|---|---|---|---|---|---|---|---|---|---|---|
| 161 Sequoyah View Dr | Oakland | 1958 | 3 | 2 | 2,238 | 11,284 | $407 | $910,000 | 18 | 72 |
| 2922 Parker Ave | Oakland | 1947 | 3 | 3 | 1,522 | 4,176 | $614 | $935,000 | 52 | 68 |
| 6138 Oakdale | Oakland | 1956 | 3 | 2 | 1,616 | 8,569 | $459 | $742,500 | 73 | 65 |
| 6193 Oakdale Ave | Oakland | 2004 | 3 | 3 | 2,020 | 5,207 | $443 | $895,000 | 37 | 64 |
| 310 Melven | San Leandro | 1922 | 3 | 2 | 1,700 | 4,800 | $509 | $864,500 | 151 | 50 |
| Total: 5 · Average | 3.0 | 2.4 | 1,819.2 | 6,807.2 | $486.4 | $869,400 | 66.2 | |||
| Median | 1,700 | $895,000 | ||||||||
Closed Properties (5)
Closed Comparables
| Address | City | Year | Date | BD | BTH | SqFt | LotSz | LP | SP | SP/SqFt | SP/LP | DIM | Score |
|---|---|---|---|---|---|---|---|---|---|---|---|---|---|
| 8497 Ney Ave | Oakland | 1958 | 11/25/2025 | 4 | 3 | 2,253 | 6,480 | $899,000 | $960,000 | $426 | 1.07 | 40 | 76 |
| 8491 Ney Ave | Oakland | 1958 | 04/07/2026 | 3 | 3 | 2,007 | 6,876 | $699,999 | $760,000 | $379 | 1.09 | 61 | 74 |
| 7968 Michigan Ave | Oakland | 1950 | 02/13/2026 | 3 | 2 | 1,801 | 10,950 | $998,000 | $927,000 | $515 | 0.93 | 245 | 72 |
| 8454 Ney Ave | Oakland | 1956 | 04/01/2026 | 3 | 2 | 1,601 | 9,310 | $759,000 | $735,000 | $459 | 0.97 | 107 | 71 |
| 7925 Greenly | Oakland | 1926 | 09/30/2026 | 3 | 4 | 1,916 | 6,018 | $799,000 | $835,000 | $436 | 1.04 | 41 | 70 |
| Total: 5 · Average | 3.2 | 2.8 | 1,915.6 | 7,926.8 | $843,400 | $843,400 | $443 | — | 98.8 | ||||
| Median | 1,916 | $835,000 | $835,000 | ||||||||||
Market Analysis
List vs Sale $/SqFt
Sale Price Trend
Days on Market
Sale vs List Price
This analysis was generated automatically from MLS data. For an in-depth, human-reviewed valuation, contact Joseph Sardella at josephsardella@gmail.com.