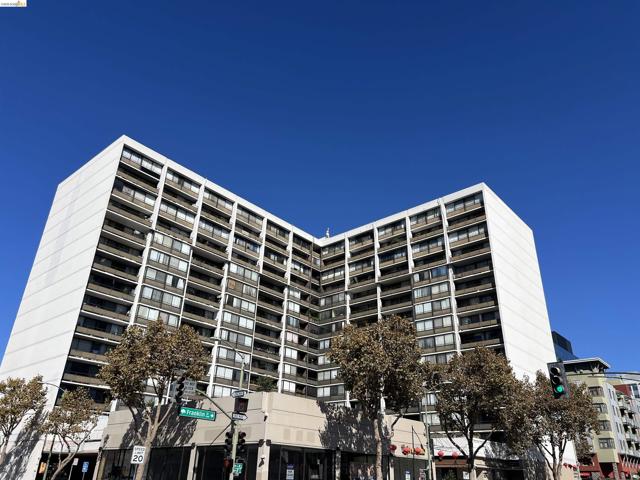
801 Franklin Street, 201, Oakland, CA 94607
801 Franklin Street, 201, Oakland, CA 94607
Property Description
Very big 1 bed 1 bath unit is used as 2 bedroom in the heart of Chinatown! Close to Restaurant, hospital, markets, subways/BART and bus stops! Elevator, roof deck in this building. Laundry washer and dryer are in the building, modern lights, gas stove in kitchen, granite counter tops and board floors, elegant window covers and huge balcony! Lower HOA fee is only $606 includes 1 parking space, water, garbage, insurance and front desk 24 hours security! Open house on Saturday & Sunday Nov. 14, 15, 21 and 22 at 12:00pm-3:00pm.
Features & Amenities
Property Details
Mortgage Calculator
Current Rates
Comparative Market Analysis
Affordable Tier · 5 active · 5 closed
Oakland · Condominium
Listed 8.8% above the median closed sale of $308,000. Price per sqft ($429) is a 15% premium to closed comps ($373).
Price Position
Positioned above the market — commands a premium.
Active Properties (5)
Active Comparables
| Address | City | Year | BD | BTH | SqFt | LotSz | LP/SqFt | LP | DIM | Score |
|---|---|---|---|---|---|---|---|---|---|---|
| 655 12th St | Oakland | 2003 | 1 | 1 | 725 | 0 | $495 | $359,000 | 30 | 85 |
| 423 7Th St | Oakland | 2008 | 1 | 1 | 854 | 32,653 | $369 | $315,000 | 65 | 84 |
| 428 Alice St | Oakland | 2006 | 1 | 1 | 780 | 30,767 | $494 | $385,000 | 121 | 81 |
| 222 Broadway | Oakland | 2009 | 1 | 1 | 694 | 35,016 | $497 | $345,000 | 37 | 80 |
| 801 Franklin St | Oakland | 1976 | 2 | 2 | 1,140 | 59,184 | $329 | $375,000 | 265 | 76 |
| Total: 5 · Average | 1.2 | 1.2 | 838.6 | 39,405 | $436.8 | $355,800 | 103.6 | |||
| Median | 780 | $359,000 | ||||||||
Closed Properties (5)
Closed Comparables
| Address | City | Year | Date | BD | BTH | SqFt | LotSz | LP | SP | SP/SqFt | SP/LP | DIM | Score |
|---|---|---|---|---|---|---|---|---|---|---|---|---|---|
| 801 Franklin St | Oakland | 1976 | 06/25/2026 | 2 | 1 | 880 | 59,184 | $339,900 | $330,000 | $375 | 0.97 | 20 | 88 |
| 801 Franklin St | Oakland | 1976 | 08/07/2026 | 2 | 1 | 975 | 59,184 | $349,999 | $345,000 | $354 | 0.99 | 28 | 85 |
| 423 7th St | Oakland | 2008 | 05/01/2026 | 1 | 1 | 791 | 0 | $329,000 | $308,000 | $389 | 0.94 | 37 | 85 |
| 330 8Th St | Oakland | 1970 | 07/07/2026 | 2 | 1 | 833 | 10,000 | $325,000 | $305,000 | $366 | 0.94 | 104 | 85 |
| 423 7Th St | Oakland | 2008 | 05/15/2026 | 1 | 1 | 785 | 32,653 | $299,900 | $298,000 | $380 | 0.99 | 79 | 82 |
| Total: 5 · Average | 1.6 | 1.0 | 852.8 | 40,255.25 | $317,200 | $317,200 | $372.8 | — | 53.6 | ||||
| Median | 833 | $308,000 | $308,000 | ||||||||||
Market Analysis
List vs Sale $/SqFt
Sale Price Trend
Days on Market
Sale vs List Price
This analysis was generated automatically from MLS data. For an in-depth, human-reviewed valuation, contact Joseph Sardella at josephsardella@gmail.com.