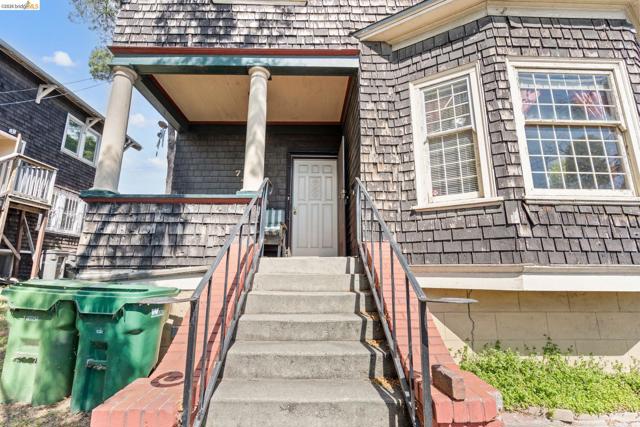
1 / 13
746 East 19Th St, Oakland, CA 94606
$749K3bd · 3ba · 1,693 sqft
Lot 5,000 sqft•Single Family Residence•Active•108d on market•MLS# 00-41143628
746 East 19Th St, Oakland, CA 94606
MLS# 00-41143628•Residential•Single Family Residence
Active108 days on market
$749,000
3
Beds
3
Baths
1,693
Sq Ft
5,000
Lot Sq Ft
1910
Year Built
Property Description
Edwardian Home near Lake Merritt and Park Blvd. Large house with Potential in Finished Basement. Full Attic is 6ft + Ceiling. Beautiful Original Hardwood Details Thoroughout Home. Kitchen Island Perfect for Dining and Sharing Cooking Experience.
Features & Amenities
FeeBuilt 1910
Property Details
Land Type
Fee
Year Built
1910
Property Type
Residential
Property Subtype
Single Family Residence
Flooring
Wood
Roof
Shingle
City
Oakland
Zip Code
94606
County
Alameda
Mortgage Calculator
Current Rates
$
$
%
Monthly Payment
$3,787.35
Principal & Interest
Loan Amount
$599,200
Total Interest
$764,247
Total Payment Over 30 Years
$1,363,447
This calculator provides estimates only. Actual mortgage payments may include taxes, insurance, HOA fees, and PMI. Contact a lender for accurate quotes.
Comparative Market Analysis
Residential Tier · 5 active · 5 closed
746 East 19Th St, Oakland, CA 94606
Oakland · Single Family Residence
$749K
Residential TierBeds
3
Baths
3
Sqft
1,693
Lot
5,000 sqft
Year
1910
$/Sqft
$442
Pool: No✓
Listed 4.0% below the median closed sale of $780,000. Closed comps sold at 103% of list — strong seller's market.
Price Position
Aligned with the market — fair pricing for the comps.
At market
Subject listed at $749K· $442/sqft
Total list price
Closed comps
vs closed median $780K
−$31K (−4.0%)
Active comps
vs active median $799K
−$50K (−6.3%)
Price per sqft
Closed compsinsufficient comp data
Active comps
vs active avg $/sqft $527
−$85 (−16.1%)
Active Properties (5)
Active Comparables
| Address | City | Year | BD | BTH | SqFt | LotSz | LP/SqFt | LP | DIM | Score |
|---|---|---|---|---|---|---|---|---|---|---|
| 2440 12Th Ave | Oakland | 1900 | 4 | 2 | 1,812 | 6,000 | $441 | $799,000 | 21 | 84 |
| 521 Zorah St | Oakland | 1919 | 3 | 2 | 1,424 | 4,400 | $561 | $799,000 | 10 | 82 |
| 1004 Elbert St | Oakland | 1916 | 3 | 2 | 1,578 | 5,890 | $538 | $849,000 | 16 | 73 |
| 2712 Logan St | Oakland | 1925 | 3 | 2 | 1,119 | 3,885 | $603 | $675,000 | 4 | 67 |
| 3414 Andover St | Oakland | 1903 | 3 | 1 | 1,320 | 6,000 | $492 | $649,000 | 30 | 63 |
| Total: 5 · Average | 3.2 | 1.8 | 1,450.6 | 5,235 | $527 | $754,200 | 16.2 | |||
| Median | 1,424 | $799,000 | ||||||||
Closed Properties (5)
Closed Comparables
| Address | City | Year | Date | BD | BTH | SqFt | LotSz | LP | SP | SP/SqFt | SP/LP | DIM | Score |
|---|---|---|---|---|---|---|---|---|---|---|---|---|---|
| 2401 9Th Ave | Oakland | 1923 | 09/04/2026 | 3 | 2 | 1,318 | 4,000 | $649,000 | $699,000 | $530 | 1.08 | 30 | 79 |
| 1116 20Th St | Oakland | 1910 | 07/08/2026 | 4 | 2 | 1,441 | 2,790 | $649,000 | $780,000 | $541 | 1.20 | 34 | 78 |
| 725 21St St | Oakland | 1880 | 04/02/2026 | 5 | 2 | 1,559 | 5,000 | $719,999 | $720,000 | $462 | 1.00 | 187 | 76 |
| 1532 5th Avenue | Oakland | 1896 | 04/16/2026 | 5 | 2 | 1,869 | 2,550 | $825,000 | $825,000 | $441 | 1.00 | 67 | 75 |
| 361 HANOVER AVENUE | Oakland | 1913 | 03/02/2026 | 5 | 3 | 2,411 | 7,250 | $899,000 | $795,000 | $330 | 0.88 | 45 | 66 |
| Total: 5 · Average | 4.4 | 2.2 | 1,719.6 | 4,318 | $763,800 | $763,800 | $460.8 | — | 72.6 | ||||
| Median | 1,559 | $780,000 | $780,000 | ||||||||||
Market Analysis
List vs Sale $/SqFt
Sale Price Trend
Days on Market
Sale vs List Price
AI-generated CMA
This analysis was generated automatically from MLS data. For an in-depth, human-reviewed valuation, contact Joseph Sardella at josephsardella@gmail.com.