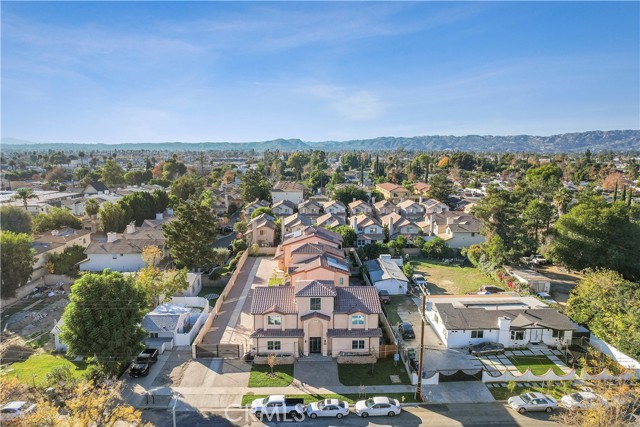
7329 Kelvin, Winnetka, CA 91306
7329 Kelvin, Winnetka, CA 91306
Property Description
NEW CONSTRUCTION – Turn Key Home. Welcome to gated Kelvin Homes! Modern home 4 bed/4.5 bath with a Great room, Open floor plan with sliding doors inviting abundant natural light, Chef’s Kitchen with center island with quartz countertop. High ceilings, Laundry located upstairs. One bedroom and one bathroom located downstairs,Powder room, Spacious master bedroom with balcony, walk in master closet, Upstairs has 3 additional bedrooms, Most Windows have shutter installed, 2 Car Garage, Paid off Solar. Move-In ready home with many upgrades, located in the center of the valley.
Features & Amenities
Property Details
Mortgage Calculator
Current Rates
Comparative Market Analysis
Luxury Tier · 5 active · 5 closed
Winnetka · Single Family Residence
Listed 10.6% above the median closed sale of $1,400,000. Luxury tier — fewer comparable sales widen the confidence range.
Price Position
Positioned above the market — commands a premium.
Active Properties (5)
Active Comparables
| Address | City | Year | BD | BTH | SqFt | LotSz | LP/SqFt | LP | DIM | Score |
|---|---|---|---|---|---|---|---|---|---|---|
| 20819 Seasons Lane | Los Angeles | 2025 | 4 | 3 | 2,575 | 17,488 | $515 | $1.32M | 92 | 83 |
| 20811 Seeasons Lane | Winnetka | 2025 | 4 | 5 | 2,925 | 6,068 | $504 | $1.48M | 108 | 76 |
| 20329 Stagg Street | Winnetka | 2025 | 5 | 5 | 3,700 | 6,028 | $430 | $1.59M | 87 | 71 |
| 6952 Cozycroft Avenue | Winnetka | 1954 | 4 | 3 | 2,251 | 7,587 | $613 | $1.38M | 123 | 67 |
| 6915 Laramie Avenue | Winnetka | 1953 | 6 | 6 | 2,825 | 8,098 | $531 | $1.50M | 118 | 67 |
| Total: 5 · Average | 4.6 | 4.4 | 2,855.2 | 9,053.8 | $518.6 | $1.45M | 105.6 | |||
| Median | 2,825 | $1.48M | ||||||||
Closed Properties (5)
Closed Comparables
| Address | City | Year | Date | BD | BTH | SqFt | LotSz | LP | SP | SP/SqFt | SP/LP | DIM | Score |
|---|---|---|---|---|---|---|---|---|---|---|---|---|---|
| 6900 Lurline Avenue | Los Angeles | 1954 | 05/05/2026 | 6 | 6 | 3,200 | 14,298 | $1.40M | $1.40M | $438 | 1.00 | 61 | 78 |
| 6546 Shoup Avenue | West Hills | 1954 | 09/29/2026 | 4 | 4 | 2,508 | 20,916 | $1.45M | $1.40M | $558 | 0.97 | 32 | 65 |
| 6233 Penfield Avenue | Woodland Hills | 1996 | 12/23/2025 | 5 | 4 | 3,382 | 19,486 | $1.90M | $1.75M | $517 | 0.92 | 81 | 65 |
| 6008 Pointe Place | Woodland Hills | 1989 | 07/23/2026 | 3 | 3 | 3,027 | 8,584 | $1.57M | $1.54M | $509 | 0.98 | 50 | 58 |
| 20624 Oxnard Street | Woodland Hills | 1961 | 06/02/2026 | 4 | 2 | 2,586 | 9,983 | $1.40M | $1.36M | $526 | 0.97 | 82 | 57 |
| Total: 5 · Average | 4.4 | 3.8 | 2,940.6 | 14,653.4 | $1.49M | $1.49M | $509.6 | — | 61.2 | ||||
| Median | 3,027 | $1.40M | $1.40M | ||||||||||
Market Analysis
List vs Sale $/SqFt
Sale Price Trend
Days on Market
Sale vs List Price
This analysis was generated automatically from MLS data. For an in-depth, human-reviewed valuation, contact Joseph Sardella at josephsardella@gmail.com.