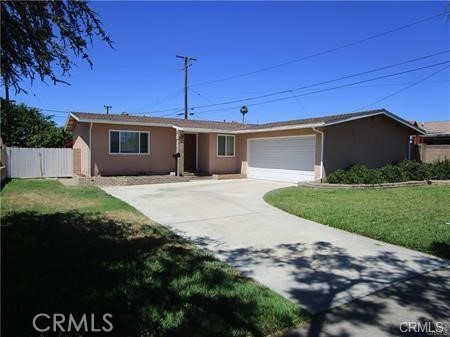
7295 Thunderbird, Stanton, CA 90680
7295 Thunderbird, Stanton, CA 90680
Property Description
Welcome home!!! Opportunity awaits, bring your paint brush and imagination. 3 bedroom, 2 bathroom, 2 car garage with direct access, single story home. This home features central air conditioning and heating, dual pane vinyl windows, custom french doors to back yard, spacious kitchen area, with appliances, inside laundry room, and upgraded bathrooms. This property is conveniently located near area shopping center's restaurant's and the Stanton Central Park.
Features & Amenities
Property Details
Mortgage Calculator
Current Rates
Comparative Market Analysis
Affordable Tier · 5 active · 5 closed
Not Applicable · Stanton · Single Family Residence
Listed in line with the median closed sale of $840,000. Closed comps sold at 102% of list — strong seller's market.
Price Position
Aligned with the market — fair pricing for the comps.
Active Properties (5)
Active Comparables
| Address | City | Year | BD | BTH | SqFt | LotSz | LP/SqFt | LP | DIM | Score |
|---|---|---|---|---|---|---|---|---|---|---|
| 7251 Middlesex | Stanton | 1959 | 3 | 2 | 1,205 | 7,400 | $780 | $939,999 | 16 | 97 |
| 10606 Hamden | Stanton | 1959 | 3 | 2 | 1,205 | 6,060 | $746 | $899,000 | 10 | 95 |
| 3643 W Myra Ave | Anaheim | 1959 | 3 | 2 | 1,256 | 6,100 | $744 | $935,000 | 11 | 91 |
| 11077 Robinson | Stanton | 1964 | 4 | 2 | 1,348 | 1,453 | $549 | $740,000 | 32 | 84 |
| 3150 Teranimar | Anaheim | 1962 | 3 | 2 | 1,434 | 10,290 | $627 | $899,000 | 2 | 82 |
| Total: 5 · Average | 3.2 | 2.0 | 1,289.6 | 6,260.6 | $689.2 | $882,599.8 | 14.2 | |||
| Median | 1,256 | $899,000 | ||||||||
Closed Properties (5)
Closed Comparables
| Address | City | Year | Date | BD | BTH | SqFt | LotSz | LP | SP | SP/SqFt | SP/LP | DIM | Score |
|---|---|---|---|---|---|---|---|---|---|---|---|---|---|
| 7251 Middlesex Dr | Stanton | 1959 | 07/14/2026 | 3 | 2 | 1,205 | 7,400 | $826,000 | $840,000 | $697 | 1.02 | 102 | 95 |
| 10321 Courtright Road | Stanton | 1959 | 06/26/2026 | 3 | 2 | 1,202 | 6,600 | $825,000 | $840,000 | $699 | 1.02 | 24 | 94 |
| 10820 Hamden | Stanton | 1959 | 07/09/2026 | 3 | 2 | 1,205 | 7,820 | $875,000 | $895,000 | $743 | 1.02 | 43 | 93 |
| 10271 Garrett Road | Stanton | 1959 | 07/28/2026 | 3 | 2 | 1,203 | 6,200 | $798,888 | $821,000 | $682 | 1.03 | 103 | 93 |
| 10831 Cedar | Stanton | 1965 | 08/27/2026 | 3 | 2 | 1,120 | 6,885 | $899,000 | $930,000 | $830 | 1.03 | 100 | 90 |
| Total: 5 · Average | 3.0 | 2.0 | 1,187 | 6,981 | $865,200 | $865,200 | $730.2 | — | 74.4 | ||||
| Median | 1,203 | $840,000 | $840,000 | ||||||||||
Market Analysis
List vs Sale $/SqFt
Sale Price Trend
Days on Market
Sale vs List Price
This analysis was generated automatically from MLS data. For an in-depth, human-reviewed valuation, contact Joseph Sardella at josephsardella@gmail.com.