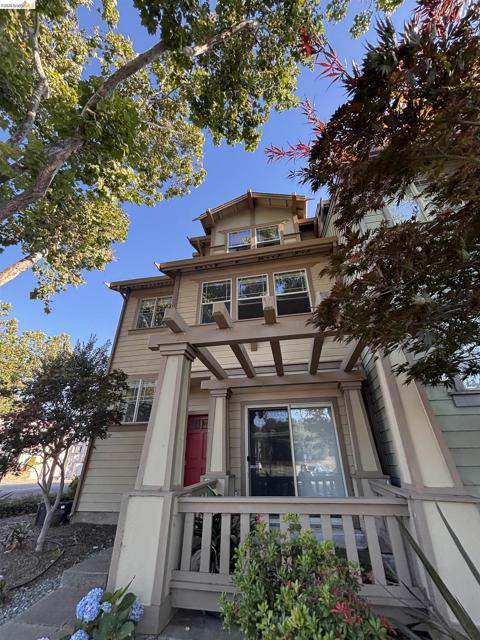
659 Macarthur Blvd., San Leandro, CA 94577
659 Macarthur Blvd., San Leandro, CA 94577
Property Description
Great investment opportunity! Built in 2008, this spacious 3-bedroom, 3.5-bathroom condo boasts 1,732 sq. ft. of versatile living space with flexible multi-level accommodation. Centrally located near shopping, schools, and major commuter corridors. Being offered through auction status, presenting high-upside potential for savvy investors looking for key real estate placement. Property is occupied—no interior access or showings available prior to purchase. Sold as-is. Do not disturb the residents.
Features & Amenities
Property Details
Mortgage Calculator
Current Rates
Comparative Market Analysis
Residential Tier · 1 active · 5 closed
San Leandro · Townhouse
Listed 5.0% above the median closed sale of $700,000.
Price Position
Positioned above the market — commands a premium.
Active Properties (1)
Active Comparables
| Address | City | Year | BD | BTH | SqFt | LotSz | LP/SqFt | LP | DIM | Score |
|---|---|---|---|---|---|---|---|---|---|---|
| 2231 Heathrow Pl | San Leandro | 1979 | 3 | 3 | 1,659 | 2,054 | $431 | $715,000 | 117 | 69 |
| Total: 1 · Average | 3.0 | 3.0 | 1,659 | 2,054 | $431 | $715,000 | 117 | |||
| Median | 1,659 | $715,000 | ||||||||
Closed Properties (5)
Closed Comparables
| Address | City | Year | Date | BD | BTH | SqFt | LotSz | LP | SP | SP/SqFt | SP/LP | DIM | Score |
|---|---|---|---|---|---|---|---|---|---|---|---|---|---|
| 651 Macarthur Blvd | San Leandro | 2008 | 04/20/2026 | 3 | 4 | 1,732 | 1,494 | $699,999 | $700,000 | $404 | 1.00 | 65 | 94 |
| 653 Macarthur Blvd | San Leandro | 2008 | 04/29/2026 | 3 | 4 | 1,732 | 1,223 | $650,000 | $648,000 | $374 | 1.00 | 223 | 93 |
| 10875 Packard St. | Oakland | 2002 | 07/17/2026 | 3 | 2 | 1,734 | 16,158 | $679,000 | $625,000 | $360 | 0.92 | 63 | 69 |
| 2487 Heathrow Ln | San Leandro | 1978 | 07/31/2026 | 3 | 3 | 1,723 | 2,222 | $724,900 | $725,000 | $421 | 1.00 | 57 | 65 |
| 77 Ironwood | Oakland | 1977 | 11/10/2026 | 3 | 3 | 1,636 | 2,404 | $780,000 | $760,000 | $465 | 0.97 | 46 | 64 |
| Total: 5 · Average | 3.0 | 3.2 | 1,711.4 | 4,700.2 | $691,600 | $691,600 | $404.8 | — | 90.8 | ||||
| Median | 1,732 | $700,000 | $700,000 | ||||||||||
Market Analysis
List vs Sale $/SqFt
Sale Price Trend
Days on Market
Sale vs List Price
This analysis was generated automatically from MLS data. For an in-depth, human-reviewed valuation, contact Joseph Sardella at josephsardella@gmail.com.