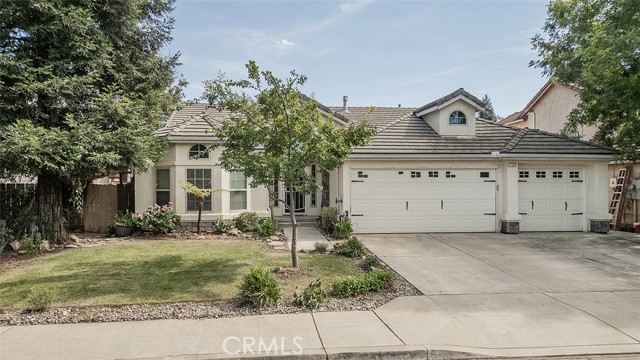
6589 East Michigan, Fresno, CA 93727
6589 East Michigan, Fresno, CA 93727
Property Description
Built in 2005, this single-story home offers 2,005 sq. ft. of living space on a 6,500 sq. ft. lot. A charming front entry with steps leads to the welcoming interior, featuring 3 bedrooms, 2 bathrooms, and a versatile bonus room that could serve as a potential 4th bedroom, home office, or flex space. The desirable 3-car garage provides ample parking and storage. With a little TLC, this home presents an excellent opportunity to build equity and transform it into your dream home. Conveniently located near schools, shopping, and everyday amenities, this property offers great potential for buyers looking to add their personal touch.
Features & Amenities
Property Details
Mortgage Calculator
Current Rates
Comparative Market Analysis
Affordable Tier · 5 active · 5 closed
Fresno · Single Family Residence
Listed in line with the median closed sale of $445,000. Price per sqft ($224) is a 12% discount to closed comps ($254).
Price Position
Aligned with the market — fair pricing for the comps.
Active Properties (5)
Active Comparables
| Address | City | Year | BD | BTH | SqFt | LotSz | LP/SqFt | LP | DIM | Score |
|---|---|---|---|---|---|---|---|---|---|---|
| 2434 Leanna | Fresno | 2018 | 3 | 2 | 1,895 | 6,000 | $261 | $495,000 | 4 | 86 |
| 6231 Berkeley | Fresno | 2021 | 4 | 3 | 1,835 | 4,275 | $251 | $460,000 | 23 | 78 |
| 2670 Bliss | Clovis | 1991 | 4 | 3 | 2,102 | 8,829 | $233 | $490,000 | 69 | 71 |
| 3415 Amanecer Avenue | Clovis | 2018 | 3 | 3 | 1,900 | 3,060 | $237 | $450,000 | 144 | 69 |
| 379 Shirley | Fresno | 1985 | 3 | 2 | 1,565 | 6,300 | $265 | $415,000 | 14 | 67 |
| Total: 5 · Average | 3.4 | 2.6 | 1,859.4 | 5,692.8 | $249.4 | $462,000 | 50.8 | |||
| Median | 1,895 | $460,000 | ||||||||
Closed Properties (5)
Closed Comparables
| Address | City | Year | Date | BD | BTH | SqFt | LotSz | LP | SP | SP/SqFt | SP/LP | DIM | Score |
|---|---|---|---|---|---|---|---|---|---|---|---|---|---|
| 7357 Redlands | Fresno | 2008 | 06/08/2026 | 3 | 2 | 1,699 | 6,204 | $458,888 | $445,000 | $262 | 0.97 | 63 | 85 |
| 7071 Dayton | Fresno | 2006 | 06/25/2026 | 4 | 3 | 2,063 | 5,472 | $489,000 | $480,000 | $233 | 0.98 | 59 | 84 |
| 2136 Redda Road | Fresno | 2021 | 08/21/2026 | 3 | 2 | 1,600 | 7,000 | $430,000 | $430,000 | $269 | 1.00 | 30 | 81 |
| 6883 Robinson | Fresno | 2019 | 06/03/2026 | 4 | 3 | 2,280 | 5,000 | $499,000 | $499,000 | $219 | 1.00 | 89 | 77 |
| 6217 Mia Drive | Clovis | 2019 | 07/10/2026 | 2 | 3 | 1,477 | 3,404 | $435,000 | $425,000 | $288 | 0.98 | 96 | 75 |
| Total: 5 · Average | 3.2 | 2.6 | 1,823.8 | 5,416 | $455,800 | $455,800 | $254.2 | — | 67.4 | ||||
| Median | 1,699 | $445,000 | $445,000 | ||||||||||
Market Analysis
List vs Sale $/SqFt
Sale Price Trend
Days on Market
Sale vs List Price
This analysis was generated automatically from MLS data. For an in-depth, human-reviewed valuation, contact Joseph Sardella at josephsardella@gmail.com.