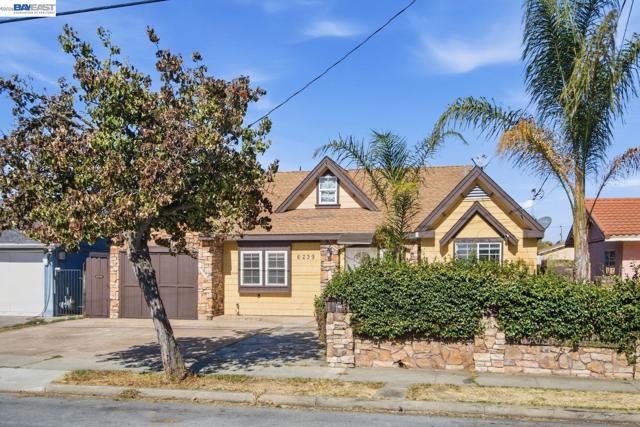
6239 Dairy Ave, Newark, CA 94560
6239 Dairy Ave, Newark, CA 94560
Property Description
Welcome to 6239 Dairy Avenue in Newark! This inviting single-story home offers 4 bedrooms, 2 bathrooms, a family room, and approximately 1,285 sq. ft. of living space, refreshed with new interior paint. A detached, bonus structure of approximately 165 sq. ft. features a loft and private deck. Enjoy outdoor dining beneath the covered patio and a spacious, fenced backyard with room to relax, garden, and entertain. Conveniently located near shopping, dining, and local parks, with access to I-880, Highway 84, and the Dumbarton Bridge for commutes to Fremont, the Peninsula, and Silicon Valley. A welcoming home with versatile space and plenty of room to enjoy the outdoors!
Features & Amenities
Property Details
Mortgage Calculator
Current Rates
Comparative Market Analysis
Affordable Tier · 1 active · 5 closed
Newark · Single Family Residence
Listed in line with the median closed sale of $1,212,049. Price per sqft ($1,122) is a 25% premium to closed comps ($895). Closed comps sold at 103% of list — strong seller's market.
Price Position
Aligned with the market — fair pricing for the comps.
Active Properties (1)
Active Comparables
| Address | City | Year | BD | BTH | SqFt | LotSz | LP/SqFt | LP | DIM | Score |
|---|---|---|---|---|---|---|---|---|---|---|
| 36095 San Pedro DR | Fremont | 1956 | 3 | 2 | 1,148 | 15,606 | $1,089 | $1.25M | 46 | 75 |
| Total: 1 · Average | 3.0 | 2.0 | 1,148 | 15,606 | $1,089 | $1.25M | 46 | |||
| Median | 1,148 | $1.25M | ||||||||
Closed Properties (5)
Closed Comparables
| Address | City | Year | Date | BD | BTH | SqFt | LotSz | LP | SP | SP/SqFt | SP/LP | DIM | Score |
|---|---|---|---|---|---|---|---|---|---|---|---|---|---|
| 36605 Hafner St | Newark | 1954 | 06/09/2026 | 3 | 2 | 1,266 | 6,348 | $1.09M | $1.09M | $860 | 1.00 | 40 | 86 |
| 36637 Burdick St | Newark | 1957 | 06/10/2026 | 3 | 2 | 1,288 | 5,096 | $999,900 | $1.11M | $862 | 1.11 | 35 | 82 |
| 36523 Cherry St | Newark | 1959 | 12/22/2025 | 3 | 2 | 1,175 | 5,680 | $1.20M | $1.21M | $1,032 | 1.01 | 104 | 81 |
| 36632 Magnolia St | Newark | 1948 | 07/06/2026 | 3 | 2 | 1,456 | 7,500 | $1.35M | $1.34M | $918 | 0.99 | 84 | 77 |
| 36751 Bishop St | Newark | 1958 | 09/16/2026 | 3 | 2 | 1,538 | 5,700 | $1.20M | $1.24M | $803 | 1.03 | 41 | 76 |
| Total: 5 · Average | 3.0 | 2.0 | 1,344.6 | 6,064.8 | $1.20M | $1.20M | $895 | — | 60.8 | ||||
| Median | 1,288 | $1.21M | $1.21M | ||||||||||
Market Analysis
List vs Sale $/SqFt
Sale Price Trend
Days on Market
Sale vs List Price
This analysis was generated automatically from MLS data. For an in-depth, human-reviewed valuation, contact Joseph Sardella at josephsardella@gmail.com.