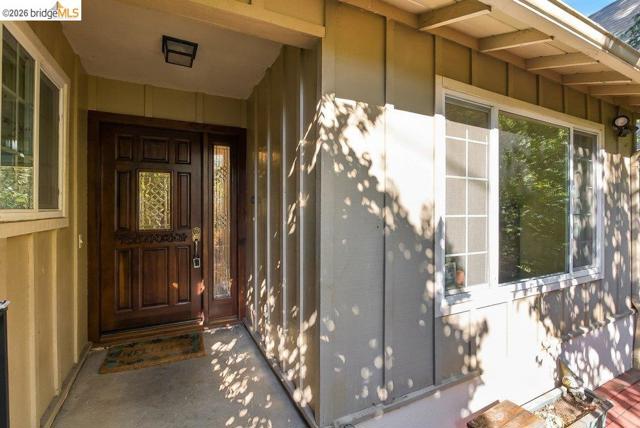
6139 Westover Dr, Oakland, CA 94611
6139 Westover Dr, Oakland, CA 94611
Property Description
Good bones? Check. Beautiful SF Bay view? Check. Lovely woodsy setting in Montclair's Piedmont Pines neighborhood, with top rated schools, close to Montclair Villiage and a quick jaunt to the Bay Bridge? Double check! In the same family since it was built in 1965, this home is ready to be modernized to your taste. Flexible layout and bonus rooms easily allow for four bedrooms, with a separate entrance to the lower level making for a perfect set-up for an in-law unit, home office or studio, or multigenerational living. Decks offer wonderful canyon and SF views, and a two car garage adds convenience. Extra large lot could be terraced (like the next door neighbors did!), for additional outdoor spaces. Come bring your vision and see! Open house Sun, Nov 22.
Features & Amenities
Property Details
Mortgage Calculator
Current Rates
Comparative Market Analysis
Residential Tier · 5 active · 5 closed
Oakland · Single Family Residence
Listed 7.1% above the median closed sale of $630,000. Price per sqft ($290) is a 30% discount to closed comps ($413). Closed comps sold at 94% of list — buyers have negotiating leverage. Comparable homes are moving quickly (avg 30 days on market).
Price Position
Positioned above the market — commands a premium.
Active Properties (5)
Active Comparables
| Address | City | Year | BD | BTH | SqFt | LotSz | LP/SqFt | LP | DIM | Score |
|---|---|---|---|---|---|---|---|---|---|---|
| 6912 Balsam Way | Oakland | 1922 | 2 | 2 | 1,346 | 6,804 | $519 | $699,000 | 18 | 56 |
| 190 Northern Railway | 1920 | 3 | 1 | 1,360 | 7,659 | $511 | $695,000 | 366 | 48 | |
| 3221 Delaware St | Oakland | 1924 | 3 | 2 | 1,117 | 6,000 | $636 | $710,000 | 85 | 47 |
| 5430 Estates DR | Oakland | 1917 | 1 | 1 | 648 | 10,643 | $923 | $598,000 | 59 | 45 |
| 273 Beauforest Dr | Oakland | 1939 | 2 | 1 | 506 | 16,027 | $1,354 | $685,000 | 27 | 42 |
| Total: 5 · Average | 2.2 | 1.4 | 995.4 | 9,426.6 | $788.6 | $677,400 | 111 | |||
| Median | 1,117 | $695,000 | ||||||||
Closed Properties (5)
Closed Comparables
| Address | City | Year | Date | BD | BTH | SqFt | LotSz | LP | SP | SP/SqFt | SP/LP | DIM | Score |
|---|---|---|---|---|---|---|---|---|---|---|---|---|---|
| 6334 Doran Dr | Oakland | 1966 | 05/19/2026 | 3 | 3 | 1,532 | 6,448 | $799,000 | $625,000 | $408 | 0.78 | 22 | 74 |
| 7279 Snake Rd | Oakland | 1959 | 06/25/2026 | 3 | 2 | 1,585 | 8,250 | $649,000 | $750,000 | $473 | 1.16 | 20 | 71 |
| 33 Eastwood Ct | Oakland | 1970 | 07/14/2026 | 3 | 2 | 1,547 | 5,980 | $839,000 | $770,000 | $498 | 0.92 | 62 | 68 |
| 7875 Skyline BLVD | Oakland | 1974 | 12/11/2025 | 3 | 2 | 1,720 | 7,728 | $630,000 | $630,000 | $366 | 1.00 | 0 | 67 |
| 7403 Skyline Blvd | Oakland | 1965 | 11/24/2025 | 2 | 3 | 1,886 | 2,295 | $695,000 | $600,000 | $318 | 0.86 | 46 | 63 |
| Total: 5 · Average | 2.8 | 2.4 | 1,654 | 6,140.2 | $675,000 | $675,000 | $412.6 | — | 30 | ||||
| Median | 1,585 | $630,000 | $630,000 | ||||||||||
Market Analysis
List vs Sale $/SqFt
Sale Price Trend
Days on Market
Sale vs List Price
This analysis was generated automatically from MLS data. For an in-depth, human-reviewed valuation, contact Joseph Sardella at josephsardella@gmail.com.