1 / 12
6112 Panama Ave, Richmond, CA 94804
$599K2bd · 1ba · 895 sqft
Lot 5,000 sqft•Single Family Residence•Active•18d on market•MLS# 00-41152747
6112 Panama Ave, Richmond, CA 94804
MLS# 00-41152747•Residential•Single Family Residence
Active18 days on market
$599,000
2
Beds
1
Baths
895
Sq Ft
5,000
Lot Sq Ft
1938
Year Built
Property Description
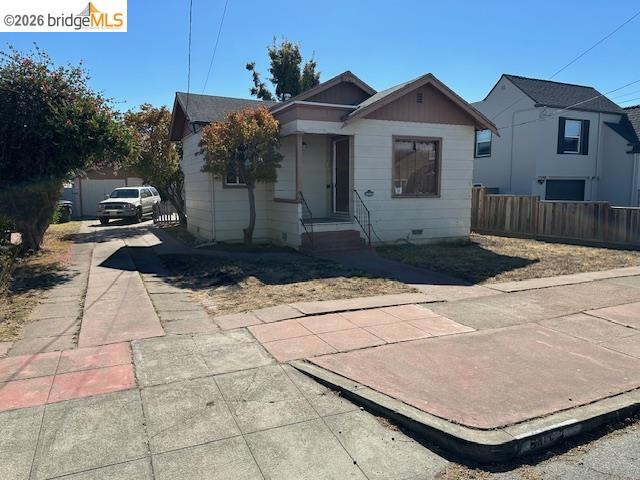
2 bedroom, 1 bath. Shows well. Lots of potential here for those looking for a fixer. Big lot has detached garage and separate out building that could be an office or artist studio. Fantastic neighborhood. Just down from El Cerrito Natural Grocery, the public library, small neighborhood children's park on Carlson, and excellent public transit.
Features & Amenities
FeeBuilt 1938
Property Details
Land Type
Fee
Year Built
1938
Property Type
Residential
Property Subtype
Single Family Residence
Flooring
Vinyl, Carpet, Wood
Roof
Shingle
City
Richmond
Zip Code
94804
County
Contra Costa
Mortgage Calculator
Current Rates
$
$
%
Monthly Payment
$3,028.87
Principal & Interest
Loan Amount
$479,200
Total Interest
$611,193
Total Payment Over 30 Years
$1,090,393
This calculator provides estimates only. Actual mortgage payments may include taxes, insurance, HOA fees, and PMI. Contact a lender for accurate quotes.
Comparative Market Analysis
Affordable Tier · 5 active · 5 closed
6112 Panama Ave, Richmond, CA 94804
Richmond · Single Family Residence
$599K
Affordable TierBeds
2
Baths
1
Sqft
895
Lot
5,000 sqft
Year
1938
$/Sqft
$669
Pool: No✓
Listed 4.2% below the median closed sale of $625,000. Closed comps sold at 105% of list — strong seller's market.
Price Position
Aligned with the market — fair pricing for the comps.
At market
Subject listed at $599K· $669/sqft
Total list price
Closed comps
vs closed median $625K
−$26K (−4.2%)
Active comps
vs active median $579K
+$20K (+3.5%)
Price per sqft
Closed compsinsufficient comp data
Active comps
vs active avg $/sqft $612
+$57 (+9.3%)
Active Properties (5)
Active Comparables
| Address | City | Year | BD | BTH | SqFt | LotSz | LP/SqFt | LP | DIM | Score |
|---|---|---|---|---|---|---|---|---|---|---|
| 1333 Mariposa St | Richmond | 1941 | 2 | 1 | 857 | 5,000 | $676 | $579,000 | 45 | 88 |
| 1339 Mariposa St | Richmond | 1948 | 2 | 1 | 956 | 3,700 | $596 | $570,000 | 46 | 84 |
| 623 Clayton Ave | El Cerrito | 1927 | 1 | 1 | 705 | 3,700 | $976 | $688,000 | 44 | 80 |
| 832 45Th St | Richmond | 1952 | 3 | 1 | 1,181 | 4,000 | $508 | $599,999 | 5 | 70 |
| 4738 Arno Ct | Richmond | 1975 | 3 | 2 | 1,891 | 18,400 | $304 | $575,000 | 9 | 43 |
| Total: 5 · Average | 2.2 | 1.2 | 1,118 | 6,960 | $612 | $602,399.8 | 29.8 | |||
| Median | 956 | $579,000 | ||||||||
Closed Properties (5)
Closed Comparables
| Address | City | Year | Date | BD | BTH | SqFt | LotSz | LP | SP | SP/SqFt | SP/LP | DIM | Score |
|---|---|---|---|---|---|---|---|---|---|---|---|---|---|
| 5101 Tehama Ave | Richmond | 1942 | 09/11/2026 | 3 | 1 | 1,050 | 5,400 | $599,000 | $625,000 | $595 | 1.04 | 65 | 83 |
| 1406 Monterey St | Richmond | 1943 | 01/23/2026 | 2 | 1 | 832 | 5,300 | $599,000 | $582,500 | $700 | 0.97 | 57 | 82 |
| 1427 Mariposa St | Richmond | 1948 | 08/18/2026 | 3 | 1 | 1,010 | 5,000 | $599,000 | $650,000 | $644 | 1.08 | 34 | 81 |
| 7603 Terrace Dr | El Cerrito | 1924 | 04/06/2026 | 1 | 1 | 807 | 11,322 | $629,000 | $640,000 | $793 | 1.02 | 40 | 72 |
| 1354 Santa Clara St. | Richmond | 1924 | 01/29/2026 | 3 | 2 | 1,193 | 4,181 | $525,000 | $585,000 | $490 | 1.11 | 24 | 65 |
| Total: 5 · Average | 2.4 | 1.2 | 978.4 | 6,240.6 | $616,500 | $616,500 | $644.4 | — | 44 | ||||
| Median | 1,010 | $625,000 | $625,000 | ||||||||||
Market Analysis
List vs Sale $/SqFt
Sale Price Trend
Days on Market
Sale vs List Price
AI-generated CMA
This analysis was generated automatically from MLS data. For an in-depth, human-reviewed valuation, contact Joseph Sardella at josephsardella@gmail.com.