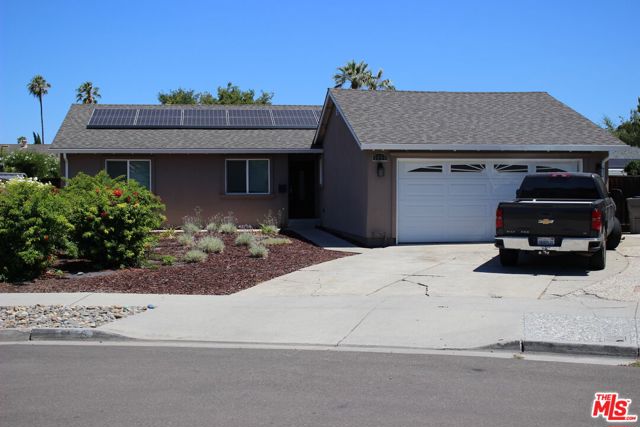
5950 Jacques Drive, San Jose, CA 95123
5950 Jacques Drive, San Jose, CA 95123
Property Description
Perfect South San Jose Starter Home! This 3 Bedroom, 2 bath in 1228 square feet has a large back yard and is situated in a beautiful neighborhood with mountain views. Short drive to Oakridge Mall. Easy access to 85 and 87. Close to parks and good schools: Sakamoto Elementary, Herman Intermediate, and Santa Teresa HS.
Features & Amenities
Property Details
Mortgage Calculator
Current Rates
Comparative Market Analysis
Affordable Tier · 1 active · 5 closed
San Jose · Single Family Residence
Listed 3.0% above the median closed sale of $1,340,000. Price per sqft ($1,124) is a 15% premium to closed comps ($976). Closed comps sold at 101% of list — strong seller's market.
Price Position
Aligned with the market — fair pricing for the comps.
Active Properties (1)
Active Comparables
| Address | City | Year | BD | BTH | SqFt | LotSz | LP/SqFt | LP | DIM | Score |
|---|---|---|---|---|---|---|---|---|---|---|
| 589 Elvis Drive | San Jose | 1968 | 4 | 2 | 1,926 | 6,222 | $778 | $1.50M | 2 | 68 |
| Total: 1 · Average | 4.0 | 2.0 | 1,926 | 6,222 | $778 | $1.50M | 2 | |||
| Median | 1,926 | $1.50M | ||||||||
Closed Properties (5)
Closed Comparables
| Address | City | Year | Date | BD | BTH | SqFt | LotSz | LP | SP | SP/SqFt | SP/LP | DIM | Score |
|---|---|---|---|---|---|---|---|---|---|---|---|---|---|
| 6093 Blacklock Ct | San Jose | 1968 | 06/15/2026 | 3 | 2 | 1,143 | 5,985 | $1.30M | $1.34M | $1,174 | 1.03 | 36 | 78 |
| 6198 Hancock Ave | San Jose | 1968 | 01/16/2026 | 4 | 2 | 1,342 | 5,985 | $1.42M | $1.27M | $950 | 0.90 | 73 | 77 |
| 339 Avenida Nogales | San Jose | 1968 | 06/17/2026 | 3 | 2 | 1,440 | 6,360 | $1.29M | $1.34M | $931 | 1.03 | 37 | 76 |
| 408 Santa Mesa DR | San Jose | 1966 | 09/30/2026 | 3 | 2 | 1,649 | 6,099 | $1.30M | $1.33M | $810 | 1.03 | 24 | 76 |
| 667 Apache Ct. | San Jose | 1962 | 02/23/2026 | 4 | 2 | 1,516 | 6,565 | $1.45M | $1.54M | $1,016 | 1.06 | 25 | 73 |
| Total: 5 · Average | 3.4 | 2.0 | 1,418 | 6,198.8 | $1.37M | $1.37M | $976.2 | — | 39 | ||||
| Median | 1,440 | $1.34M | $1.34M | ||||||||||
Market Analysis
List vs Sale $/SqFt
Sale Price Trend
Days on Market
Sale vs List Price
This analysis was generated automatically from MLS data. For an in-depth, human-reviewed valuation, contact Joseph Sardella at josephsardella@gmail.com.