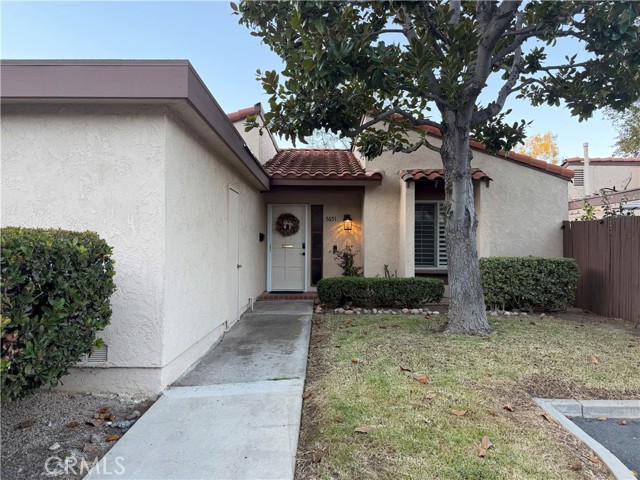
5651 East Plaza De Santos, Anaheim, CA 92807
5651 East Plaza De Santos, Anaheim, CA 92807
Property Description
Charming Anaheim hills opportunity, Discover the potential of this inviting 2-bedroom, 1-bathroom home in the desirable Anaheim Hills area. Offering approximately 982 square feet of living space and attached garage, Inside Laundry, this property present an excellent opportunity for first time buyers seeking a comfortable home in Orange County. With a practical layout and an opportunity to make the space your own, this home may be an appealing option for first time buyers, those looking to downsize, or buyers seeking to personalize a property to fit their lifestyle. Enjoy the convenience of an Anaheim location while exploring the shopping, dining, recreation, and everyday amenities available throughout the surrounding area.
Features & Amenities
Property Details
Mortgage Calculator
Current Rates
Comparative Market Analysis
Affordable Tier · 5 active · 5 closed
Anaheim · Condominium
Listed 8.0% above the median closed sale of $625,000.
Price Position
Positioned above the market — commands a premium.
Active Properties (5)
Active Comparables
| Address | City | Year | BD | BTH | SqFt | LotSz | LP/SqFt | LP | DIM | Score |
|---|---|---|---|---|---|---|---|---|---|---|
| 5040 Hunsford | Orange | 1995 | 2 | 2 | 1,018 | 387,274 | $678 | $689,999 | 10 | 76 |
| 20004 Waverly Glen | Yorba Linda | 1979 | 2 | 2 | 1,017 | 236,897 | $615 | $625,000 | 42 | 75 |
| 20008 Waverly Glen | Yorba Linda | 1979 | 3 | 2 | 1,062 | 236,897 | $645 | $685,000 | 17 | 74 |
| 6530 Shady Gate | Yorba Linda | 1977 | 3 | 2 | 1,062 | 189,897 | $636 | $675,000 | 74 | 73 |
| 20461 Elm Hill | Yorba Linda | 1977 | 3 | 2 | 1,062 | 212,444 | $653 | $694,000 | 53 | 71 |
| Total: 5 · Average | 2.6 | 2.0 | 1,044.2 | 252,681.8 | $645.4 | $673,799.8 | 39.2 | |||
| Median | 1,062 | $685,000 | ||||||||
Closed Properties (5)
Closed Comparables
| Address | City | Year | Date | BD | BTH | SqFt | LotSz | LP | SP | SP/SqFt | SP/LP | DIM | Score |
|---|---|---|---|---|---|---|---|---|---|---|---|---|---|
| 20276 Greenhill Lane | Yorba Linda | 1976 | 06/10/2026 | 2 | 2 | 1,017 | 0 | $638,000 | $608,000 | $598 | 0.95 | 72 | 79 |
| 6821 Rocky Grove Court | Yorba Linda | 1973 | 12/22/2025 | 2 | 1 | 841 | 0 | $625,000 | $625,000 | $743 | 1.00 | 185 | 78 |
| 20002 Wrightwood Ct #31 | Yorba Linda | 1972 | 04/02/2026 | 2 | 1 | 842 | 420,341 | $679,000 | $679,000 | $806 | 1.00 | 49 | 78 |
| 6831 Foxborough Court | Yorba Linda | 1973 | 08/03/2026 | 3 | 2 | 1,002 | 369,854 | $740,000 | $750,000 | $749 | 1.01 | 65 | 77 |
| 6437 Horse Shoe Lane | Yorba Linda | 1977 | 09/30/2026 | 2 | 2 | 1,017 | 190,153 | $600,000 | $600,000 | $590 | 1.00 | 75 | 76 |
| Total: 5 · Average | 2.2 | 1.6 | 943.8 | 326,782.667 | $652,400 | $652,400 | $697.2 | — | 89.2 | ||||
| Median | 1,002 | $625,000 | $625,000 | ||||||||||
Market Analysis
List vs Sale $/SqFt
Sale Price Trend
Days on Market
Sale vs List Price
This analysis was generated automatically from MLS data. For an in-depth, human-reviewed valuation, contact Joseph Sardella at josephsardella@gmail.com.