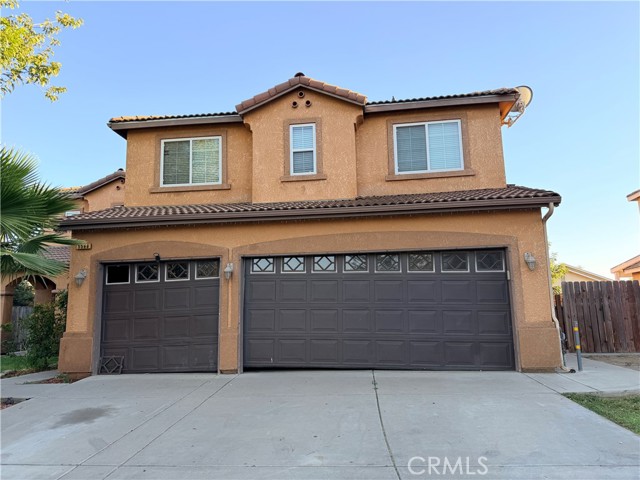
5588 East Pitt, Fresno, CA 93727
5588 East Pitt, Fresno, CA 93727
Property Description
Welcome to this two-story home offering 4 bedrooms, 3 bathrooms, and approximately 3,477 square feet of living space. A grand entry leads to separate formal living and dining rooms, while the open kitchen and family room create a comfortable setting for everyday living and entertaining. A downstairs office . Upstairs features all four bedrooms and an additional family area, perfect for a media room, game room, or relaxing retreat.
Features & Amenities
Property Details
Mortgage Calculator
Current Rates
Comparative Market Analysis
Luxury Tier · 1 active · 5 closed
Fresno · Single Family Residence
Listed 8.6% above the median closed sale of $474,000. Price per sqft ($148) is a 31% discount to closed comps ($215). Luxury tier — fewer comparable sales widen the confidence range.
Price Position
Positioned above the market — commands a premium.
Active Properties (1)
Active Comparables
| Address | City | Year | BD | BTH | SqFt | LotSz | LP/SqFt | LP | DIM | Score |
|---|---|---|---|---|---|---|---|---|---|---|
| 5170 Huntington | Fresno | 1971 | 4 | 3 | 2,252 | 12,000 | $240 | $539,900 | 56 | 56 |
| Total: 1 · Average | 4.0 | 3.0 | 2,252 | 12,000 | $240 | $539,900 | 56 | |||
| Median | 2,252 | $539,900 | ||||||||
Closed Properties (5)
Closed Comparables
| Address | City | Year | Date | BD | BTH | SqFt | LotSz | LP | SP | SP/SqFt | SP/LP | DIM | Score |
|---|---|---|---|---|---|---|---|---|---|---|---|---|---|
| 5824 Kaviland | Fresno | 2011 | 10/09/2026 | 5 | 2 | 1,855 | 8,112 | $474,990 | $474,000 | $256 | 1.00 | 48 | 75 |
| 5952 Truman | Fresno | 2020 | 06/25/2026 | 5 | 4 | 3,167 | 5,050 | $580,000 | $580,000 | $183 | 1.00 | 85 | 75 |
| 5167 Balch Avenue | Fresno | 1971 | 04/13/2026 | 4 | 3 | 2,261 | 12,000 | $460,000 | $460,000 | $203 | 1.00 | 81 | 66 |
| 5867 Club View | Fresno | 1967 | 07/14/2026 | 4 | 3 | 2,544 | 19,500 | $585,000 | $570,000 | $224 | 0.97 | 213 | 64 |
| 947 Stanford Avenue | Fresno | 1960 | 11/03/2026 | 3 | 3 | 2,166 | 16,800 | $460,000 | $450,000 | $208 | 0.98 | 132 | 61 |
| Total: 5 · Average | 4.2 | 3.0 | 2,398.6 | 12,292.4 | $506,800 | $506,800 | $214.8 | — | 111.8 | ||||
| Median | 2,261 | $474,000 | $474,000 | ||||||||||
Market Analysis
List vs Sale $/SqFt
Sale Price Trend
Days on Market
Sale vs List Price
This analysis was generated automatically from MLS data. For an in-depth, human-reviewed valuation, contact Joseph Sardella at josephsardella@gmail.com.