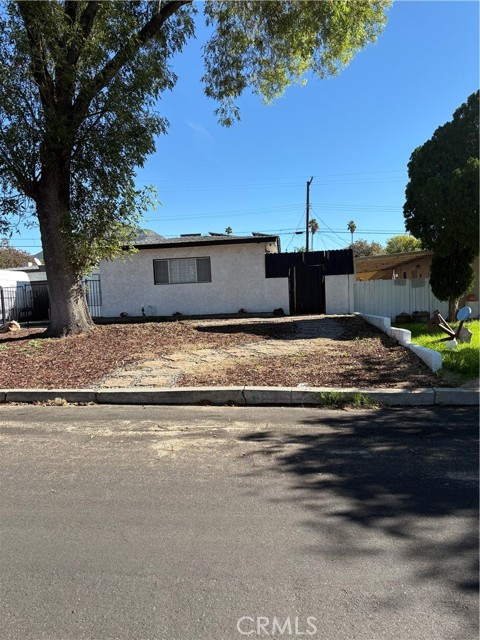
1 / 2
5549 Bonnie, San Bernardino, CA 92404
$588K4bd · 2ba · 1,431 sqft
Lot 7,480 sqft•Single Family Residence•Active•10d on market•MLS# TR-26240195
5549 Bonnie, San Bernardino, CA 92404
MLS# TR-26240195•Residential•Single Family Residence
Active10 days on market
$588,000
4
Beds
2
Baths
1,431
Sq Ft
7,480
Lot Sq Ft
1955
Year Built
None
View
Property Description
EXCELLENT LIVING IN A THRIVING COMMUNITY. ESTABLISHED . VERY NICE NEIGHBORHOOD CLOSE TO SCHOOLS, SHOPPING AND TRANSPORTATION. 4 BEDROOMS WITH 2 BATHS AND ALL ROOMS ARE VERY LARGE AND HAVE NEW FLOORING THROUGHOUT.LARGE REAR YARD AND VERY DEEP DRIVEWAY.
Features & Amenities
FeeBuilt 1955
Property Details
Land Type
Fee
Year Built
1955
Property Type
Residential
Property Subtype
Single Family Residence
Parking Spaces
2
Garage Spaces
2
Cooling
Central Air
View
None
City
San Bernardino
Zip Code
92404
County
San Bernardino
Mortgage Calculator
Current Rates
$
$
%
Monthly Payment
$2,973.25
Principal & Interest
Loan Amount
$470,400
Total Interest
$599,969
Total Payment Over 30 Years
$1,070,369
This calculator provides estimates only. Actual mortgage payments may include taxes, insurance, HOA fees, and PMI. Contact a lender for accurate quotes.
Comparative Market Analysis
Affordable Tier · 5 active · 5 closed
5549 Bonnie, San Bernardino, CA 92404
San Bernardino · Single Family Residence
$588K
Affordable TierBeds
4
Baths
2
Sqft
1,431
Lot
7,480 sqft
Year
1955
$/Sqft
$411
Pool: No✓
View: None✓
Garage: 2-car✓
Listed 14.2% above the median closed sale of $515,000. Closed comps sold at 102% of list — strong seller's market.
Price Position
Positioned above the market — commands a premium.
Premium
Subject listed at $588K· $411/sqft
Total list price
Closed comps
vs closed median $515K
+$73K (+14.2%)
Active comps
vs active median $591K
−$3K (−0.5%)
Price per sqft
Closed compsinsufficient comp data
Active comps
vs active avg $/sqft $388
+$23 (+5.9%)
Active Properties (5)
Active Comparables
| Address | City | Year | BD | BTH | SqFt | LotSz | LP/SqFt | LP | DIM | Score |
|---|---|---|---|---|---|---|---|---|---|---|
| 5738 Dogwood | San Bernardino | 1955 | 3 | 2 | 1,101 | 7,437 | $463 | $509,900 | 9 | 89 |
| 5312 Bonnie Street | San Bernardino | 1958 | 4 | 2 | 1,186 | 8,250 | $505 | $599,000 | 42 | 87 |
| 5422 Newbury Avenue | San Bernardino | 1956 | 3 | 2 | 1,548 | 7,370 | $382 | $591,000 | 22 | 87 |
| 3025 Alameda | San Bernardino | 1961 | 3 | 2 | 1,883 | 8,400 | $324 | $610,000 | 90 | 85 |
| 1490 Los Flores | San Bernardino | 1952 | 3 | 2 | 2,038 | 9,360 | $267 | $545,000 | 3 | 81 |
| Total: 5 · Average | 3.2 | 2.0 | 1,551.2 | 8,163.4 | $388.2 | $570,980 | 33.2 | |||
| Median | 1,548 | $591,000 | ||||||||
Closed Properties (5)
Closed Comparables
| Address | City | Year | Date | BD | BTH | SqFt | LotSz | LP | SP | SP/SqFt | SP/LP | DIM | Score |
|---|---|---|---|---|---|---|---|---|---|---|---|---|---|
| 5642 Osbun Road | San Bernardino | 1955 | 11/05/2026 | 3 | 2 | 1,215 | 7,344 | $499,999 | $500,000 | $412 | 1.00 | 129 | 92 |
| 5793 Osbun | San Bernardino | 1955 | 07/29/2026 | 3 | 3 | 1,451 | 9,450 | $530,000 | $520,000 | $358 | 0.98 | 232 | 88 |
| 5720 Dogwood | San Bernardino | 1955 | 07/09/2026 | 3 | 2 | 1,421 | 7,215 | $495,900 | $515,000 | $362 | 1.04 | 71 | 87 |
| 5340 Dogwood | San Bernardino | 1955 | 11/21/2025 | 4 | 2 | 1,190 | 7,260 | $509,999 | $527,500 | $443 | 1.03 | 54 | 87 |
| 5492 Newbury Avenue | San Bernardino | 1956 | 06/26/2026 | 5 | 3 | 1,677 | 7,370 | $499,000 | $515,000 | $307 | 1.03 | 77 | 86 |
| Total: 5 · Average | 3.6 | 2.4 | 1,390.8 | 7,727.8 | $515,500 | $515,500 | $376.4 | — | 112.6 | ||||
| Median | 1,421 | $515,000 | $515,000 | ||||||||||
Market Analysis
List vs Sale $/SqFt
Sale Price Trend
Days on Market
Sale vs List Price
AI-generated CMA
This analysis was generated automatically from MLS data. For an in-depth, human-reviewed valuation, contact Joseph Sardella at josephsardella@gmail.com.