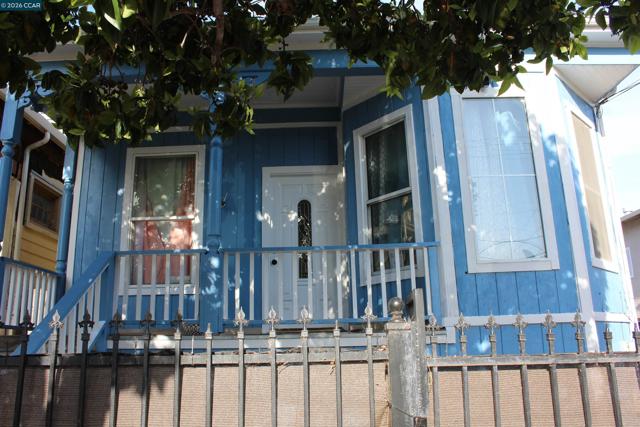
1 / 55
540 3rd ST, Richmond, CA 94801
$425K3bd · 2ba · 963 sqft
Lot 2,700 sqft•Single Family Residence•Active•119d on market•MLS# 01-41142362
540 3rd ST, Richmond, CA 94801
MLS# 01-41142362•Residential•Single Family Residence
Active119 days on market
$425,000
3
Beds
2
Baths
963
Sq Ft
2,700
Lot Sq Ft
1906
Year Built
Property Description
Welcome to this beautiful, ready to move-in 3 bedrooms 2 baths home in the Richmond Villa Subdivision area.
Features & Amenities
FeeBuilt 1906
Property Details
Land Type
Fee
Year Built
1906
Property Type
Residential
Property Subtype
Single Family Residence
Parking Spaces
0
Garage Spaces
0
Heating
See Remarks
Cooling
See Remarks
Flooring
Tile, Wood
Roof
Shingle
City
Richmond
Zip Code
94801
County
Contra Costa
Mortgage Calculator
Current Rates
$
$
%
Monthly Payment
$2,149.03
Principal & Interest
Loan Amount
$340,000
Total Interest
$433,651
Total Payment Over 30 Years
$773,651
This calculator provides estimates only. Actual mortgage payments may include taxes, insurance, HOA fees, and PMI. Contact a lender for accurate quotes.
Comparative Market Analysis
Affordable Tier · 1 active · 5 closed
540 3rd ST, Richmond, CA 94801
Richmond · Single Family Residence
$425K
Affordable TierBeds
3
Baths
2
Sqft
963
Lot
2,700 sqft
Year
1906
$/Sqft
$441
Pool: No✓
Listed 6.2% above the median closed sale of $400,000. Closed comps sold at 91% of list — buyers have negotiating leverage.
Price Position
Positioned above the market — commands a premium.
Premium
Subject listed at $425K· $441/sqft
Total list price
Closed comps
vs closed median $400K
+$25K (+6.3%)
Active comps
vs active median $399K
+$26K (+6.5%)
Price per sqft
Closed compsinsufficient comp data
Active comps
vs active avg $/sqft $383
+$58 (+15.1%)
Active Properties (1)
Active Comparables
| Address | City | Year | BD | BTH | SqFt | LotSz | LP/SqFt | LP | DIM | Score |
|---|---|---|---|---|---|---|---|---|---|---|
| 829 Yuba St | Richmond | 1947 | 3 | 2 | 1,042 | 6,000 | $383 | $399,000 | 4 | 62 |
| Total: 1 · Average | 3.0 | 2.0 | 1,042 | 6,000 | $383 | $399,000 | 4 | |||
| Median | 1,042 | $399,000 | ||||||||
Closed Properties (5)
Closed Comparables
| Address | City | Year | Date | BD | BTH | SqFt | LotSz | LP | SP | SP/SqFt | SP/LP | DIM | Score |
|---|---|---|---|---|---|---|---|---|---|---|---|---|---|
| 708 11Th St | Richmond | 1907 | 08/14/2026 | 3 | 2 | 1,130 | 3,000 | $477,700 | $400,000 | $354 | 0.84 | 37 | 88 |
| 710 11th Street | Richmond | 1960 | 07/14/2026 | 3 | 2 | 936 | 2,500 | $449,000 | $430,000 | $459 | 0.96 | 47 | 84 |
| 924 7Th St | Richmond | 1908 | 09/22/2026 | 2 | 1 | 844 | 4,000 | $495,000 | $480,000 | $569 | 0.97 | 98 | 82 |
| 860 7Th St | Richmond | 1944 | 05/28/2026 | 3 | 1 | 1,038 | 4,000 | $415,000 | $395,000 | $381 | 0.95 | 80 | 78 |
| 634 8TH St | Richmond | 1972 | 09/29/2026 | 4 | 2 | 1,100 | 4,028 | $475,000 | $390,000 | $355 | 0.82 | 166 | 78 |
| Total: 5 · Average | 3.0 | 1.6 | 1,009.6 | 3,505.6 | $419,000 | $419,000 | $423.6 | — | 85.6 | ||||
| Median | 1,038 | $400,000 | $400,000 | ||||||||||
Market Analysis
List vs Sale $/SqFt
Sale Price Trend
Days on Market
Sale vs List Price
AI-generated CMA
This analysis was generated automatically from MLS data. For an in-depth, human-reviewed valuation, contact Joseph Sardella at josephsardella@gmail.com.