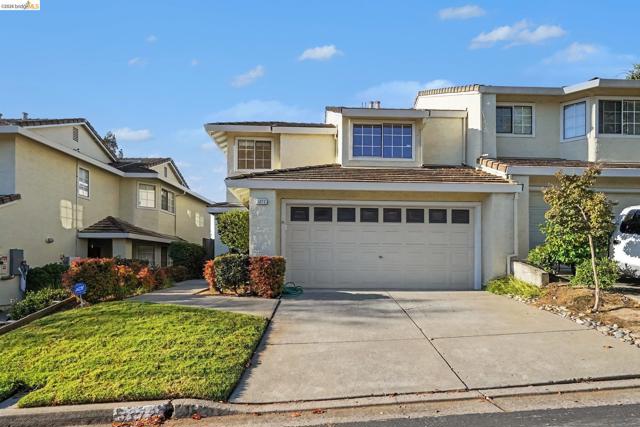
5272 Pebble Glen Dr, Concord, CA 94521
5272 Pebble Glen Dr, Concord, CA 94521
Property Description
5272 Pebble Glen Dr is a two-story Concord townhouse with a peninsula kitchen and a fireplace living room beneath a soaring ceiling. Warm-toned cabinetry lines the kitchen, with counter space extending toward the adjoining dining area. Tall living-room windows bring in light, while the upper landing overlooks the main space. Upstairs, the primary bedroom has mirrored closet storage and an adjoining bathroom with double sinks, a soaking tub and a separate shower. Additional bedrooms include corner windows and a window alcove. Sliding doors connect the dining area to a backyard deck, with lawn and established trees nearby. An attached two-car garage completes the layout.
Features & Amenities
Property Details
Mortgage Calculator
Current Rates
About Live Oak
This property is located in Live Oak, a community in Concord. Explore more listings in this neighborhood to compare options and pricing.
View Live Oak ListingsComparative Market Analysis
Residential Tier · 0 active · 5 closed
Live Oak · Concord · Townhouse
Listed 12.3% above the median closed sale of $660,000. Closed comps sold at 101% of list — strong seller's market.
Price Position
Positioned above the market — commands a premium.
Closed Properties (5)
Closed Comparables
| Address | City | Year | Date | BD | BTH | SqFt | LotSz | LP | SP | SP/SqFt | SP/LP | DIM | Score |
|---|---|---|---|---|---|---|---|---|---|---|---|---|---|
| 5256 Pebble Glen Dr | Concord | 1990 | 04/30/2026 | 3 | 3 | 1,614 | 2,816 | $739,950 | $720,000 | $446 | 0.97 | 49 | 92 |
| 4284 Dubhe Ct | Concord | 1974 | 06/04/2026 | 3 | 3 | 1,361 | 2,120 | $669,000 | $679,000 | $499 | 1.01 | 34 | 61 |
| 4243 Dubhe Ct | Concord | 1977 | 09/08/2026 | 4 | 3 | 1,948 | 2,040 | $675,000 | $660,000 | $339 | 0.98 | 64 | 56 |
| 1273 Shell Circle | Clayton | 1991 | 05/18/2026 | 3 | 3 | 1,367 | 1,675 | $639,000 | $660,000 | $483 | 1.03 | 26 | 56 |
| 565 Mt Dell Dr | Clayton | 1975 | 08/10/2026 | 4 | 3 | 1,926 | 2,623 | $599,000 | $640,000 | $332 | 1.07 | 39 | 55 |
| Total: 5 · Average | 3.4 | 3.0 | 1,643.2 | 2,254.8 | $671,800 | $671,800 | $419.8 | — | 42.4 | ||||
| Median | 1,614 | $660,000 | $660,000 | ||||||||||
Market Analysis
List vs Sale $/SqFt
Sale Price Trend
Days on Market
Sale vs List Price
This analysis was generated automatically from MLS data. For an in-depth, human-reviewed valuation, contact Joseph Sardella at josephsardella@gmail.com.