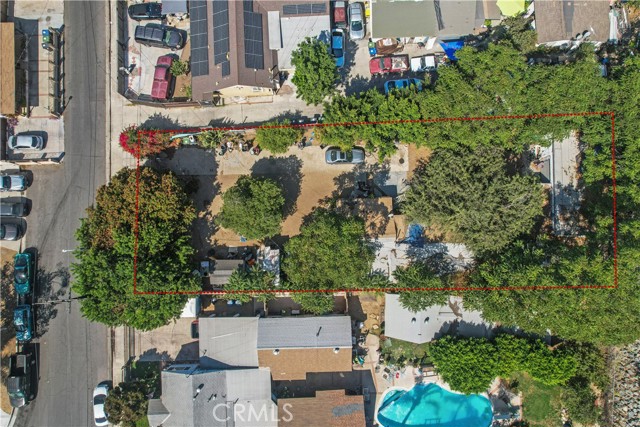
1 / 3
519 South Susan Street, Santa Ana, CA 92704
$949K1bd · 1ba · 438 sqft
Lot 12,196 sqft•Single Family Residence•Active•413d on market•MLS# PW-25230388
519 South Susan Street, Santa Ana, CA 92704
MLS# PW-25230388•Residential•Single Family Residence
Active413 days on market
$949,000
1
Beds
1
Baths
438
Sq Ft
12,196
Lot Sq Ft
1947
Year Built
None
View
Property Description
Prime Location with huge lot over 12000 SQFT. Value in land.
Features & Amenities
FeeBuilt 1947
Property Details
Land Type
Fee
Year Built
1947
Property Type
Residential
Property Subtype
Single Family Residence
Parking Spaces
1
Garage Spaces
1
Cooling
See Remarks
View
None
City
Santa Ana
Zip Code
92704
County
Orange
Mortgage Calculator
Current Rates
$
$
%
Monthly Payment
$4,798.66
Principal & Interest
Loan Amount
$759,200
Total Interest
$968,318
Total Payment Over 30 Years
$1,727,518
This calculator provides estimates only. Actual mortgage payments may include taxes, insurance, HOA fees, and PMI. Contact a lender for accurate quotes.
Comparative Market Analysis
Affordable Tier · 5 active · 5 closed
519 South Susan Street, Santa Ana, CA 92704
Santa Ana · Single Family Residence
$949K
Affordable TierBeds
1
Baths
1
Sqft
438
Lot
12,196 sqft
Year
1947
$/Sqft
$2167
Pool: No✓
View: None✓
Garage: 1-car✓
Listed in line with the median closed sale of $945,000. Price per sqft ($2,167) is a 223% premium to closed comps ($671). Closed comps sold at 100% of list — strong seller's market.
Price Position
Aligned with the market — fair pricing for the comps.
At market
Subject listed at $949K· $2,167/sqft
Total list price
Closed comps
vs closed median $945K
+$4K (+0.4%)
Active comps
vs active median $870K
+$79K (+9.1%)
Price per sqft
Closed compsinsufficient comp data
Active comps
vs active avg $/sqft $779
+$1K (+178.2%)
Active Properties (5)
Active Comparables
| Address | City | Year | BD | BTH | SqFt | LotSz | LP/SqFt | LP | DIM | Score |
|---|---|---|---|---|---|---|---|---|---|---|
| 408 Jackson Street | Santa Ana | 1955 | 2 | 1 | 926 | 7,505 | $940 | $870,000 | 87 | 63 |
| 927 Laurel | Santa Ana | 1963 | 3 | 2 | 1,229 | 6,084 | $723 | $889,000 | 22 | 57 |
| 1130 Douglas Street | Santa Ana | 1955 | 3 | 2 | 1,185 | 6,552 | $705 | $835,900 | 38 | 52 |
| 2124 Civic Center | Santa Ana | 1953 | 5 | 2 | 1,356 | 5,500 | $737 | $999,900 | 3 | 51 |
| 1209 Townsend | Santa Ana | 1959 | 3 | 2 | 1,096 | 6,500 | $789 | $865,000 | 16 | 51 |
| Total: 5 · Average | 3.2 | 1.8 | 1,158.4 | 6,428.2 | $778.8 | $891,960 | 33.2 | |||
| Median | 1,185 | $870,000 | ||||||||
Closed Properties (5)
Closed Comparables
| Address | City | Year | Date | BD | BTH | SqFt | LotSz | LP | SP | SP/SqFt | SP/LP | DIM | Score |
|---|---|---|---|---|---|---|---|---|---|---|---|---|---|
| 506 Arapaho | Santa Ana | 1963 | 05/14/2026 | 3 | 2 | 1,302 | 6,120 | $950,000 | $950,000 | $730 | 1.00 | 39 | 56 |
| 122 Gunther | Santa Ana | 1952 | 07/24/2026 | 6 | 2 | 1,823 | 7,346 | $999,990 | $1.03M | $565 | 1.03 | 42 | 56 |
| 506 Everglade | Santa Ana | 1963 | 10/19/2026 | 3 | 2 | 1,266 | 6,141 | $889,000 | $880,000 | $695 | 0.99 | 59 | 55 |
| 1013 Shawnee Drive | Santa Ana | 1962 | 06/11/2026 | 3 | 2 | 1,231 | 6,976 | $889,000 | $875,000 | $711 | 0.98 | 80 | 55 |
| 2813 Brook | Santa Ana | 1962 | 10/28/2026 | 4 | 2 | 1,446 | 6,138 | $935,000 | $945,000 | $654 | 1.01 | 163 | 54 |
| Total: 5 · Average | 3.8 | 2.0 | 1,413.6 | 6,544.2 | $936,000 | $936,000 | $671 | — | 76.6 | ||||
| Median | 1,302 | $945,000 | $945,000 | ||||||||||
Market Analysis
List vs Sale $/SqFt
Sale Price Trend
Days on Market
Sale vs List Price
AI-generated CMA
This analysis was generated automatically from MLS data. For an in-depth, human-reviewed valuation, contact Joseph Sardella at josephsardella@gmail.com.