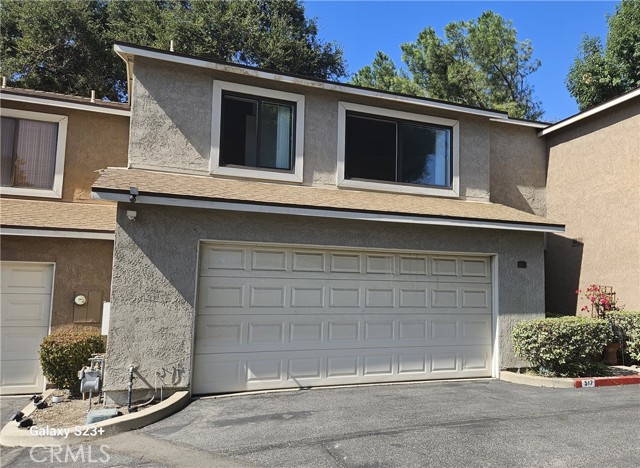
517 Wayland Court, Claremont, CA 91711
517 Wayland Court, Claremont, CA 91711
Property Description
Located steps from Claremont Village, this newly refreshed home features soaring cathedral ceilings, fresh interior paint, and Alamo Oak luxury vinyl plank flooring throughout. The kitchen boasts sleek non-porous countertops, antique bronze hardware, and newer appliances. Designed for comfort and privacy, it offers two primary-sized bedrooms with en-suite full baths, a cozy fireplace, direct garage-to-kitchen access, newer dual-pane windows, and a brand-newer central HVAC system. Step outside to an oversized private patio and yard—ideal for entertaining—plus convenient access to the community pool.
Features & Amenities
Property Details
Mortgage Calculator
Current Rates
Comparative Market Analysis
Affordable Tier · 5 active · 5 closed
Claremont · Single Family Residence
Listed 5.9% below the median closed sale of $595,000. Price per sqft ($374) is a 13% discount to closed comps ($432).
Price Position
Priced below the market — value advantage over the field.
Active Properties (5)
Active Comparables
| Address | City | Year | BD | BTH | SqFt | LotSz | LP/SqFt | LP | DIM | Score |
|---|---|---|---|---|---|---|---|---|---|---|
| 517 Wayland Court | Claremont | 1981 | 2 | 3 | 1,499 | 1,711 | $374 | $559,900 | 5 | 100 |
| 1524 Bonnie Brae Court | Ontario | 1956 | 3 | 1 | 1,105 | 6,120 | $566 | $625,000 | 13 | 60 |
| 1245 Ross | Pomona | 1956 | 3 | 2 | 1,136 | 6,065 | $555 | $630,000 | 73 | 60 |
| 1398 Sheridan | Pomona | 1915 | 4 | 3 | 1,747 | 12,078 | $283 | $495,000 | 16 | 60 |
| 1277 Essex | Pomona | 1958 | 3 | 2 | 1,143 | 7,289 | $559 | $639,000 | 11 | 57 |
| Total: 5 · Average | 3.0 | 2.2 | 1,326 | 6,652.6 | $467.4 | $589,780 | 23.6 | |||
| Median | 1,143 | $625,000 | ||||||||
Closed Properties (5)
Closed Comparables
| Address | City | Year | Date | BD | BTH | SqFt | LotSz | LP | SP | SP/SqFt | SP/LP | DIM | Score |
|---|---|---|---|---|---|---|---|---|---|---|---|---|---|
| 4630 San Jose | Montclair | 1978 | 06/11/2026 | 3 | 2 | 1,490 | 3,096 | $559,999 | $557,500 | $374 | 1.00 | 77 | 83 |
| 4622 San Jose | Montclair | 1978 | 07/24/2026 | 2 | 2 | 1,254 | 3,096 | $500,000 | $510,000 | $407 | 1.02 | 74 | 83 |
| 9343 Felipe | Montclair | 1989 | 05/11/2026 | 2 | 2 | 1,357 | 4,860 | $579,000 | $595,000 | $438 | 1.03 | 31 | 80 |
| 106 Belhaven Place | Claremont | 1957 | 11/02/2026 | 3 | 2 | 1,312 | 8,317 | $749,000 | $612,100 | $467 | 0.82 | 31 | 73 |
| 9554 Tudor | Montclair | 1957 | 08/04/2026 | 4 | 2 | 1,348 | 7,300 | $629,900 | $640,000 | $475 | 1.02 | 59 | 69 |
| Total: 5 · Average | 2.8 | 2.0 | 1,352.2 | 5,333.8 | $582,920 | $582,920 | $432.2 | — | 54.4 | ||||
| Median | 1,348 | $595,000 | $595,000 | ||||||||||
Market Analysis
List vs Sale $/SqFt
Sale Price Trend
Days on Market
Sale vs List Price
This analysis was generated automatically from MLS data. For an in-depth, human-reviewed valuation, contact Joseph Sardella at josephsardella@gmail.com.