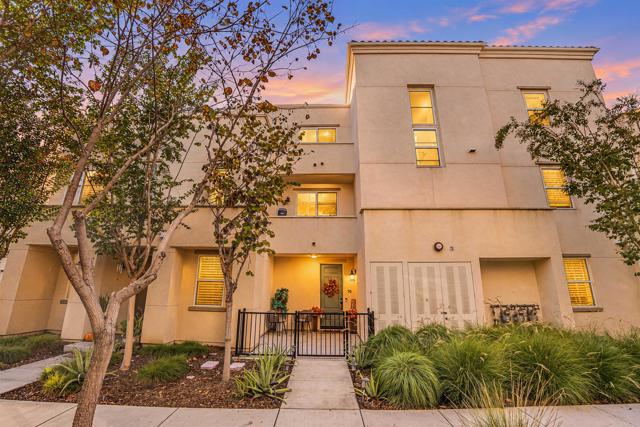
5140 Calle Sand Arch, 70, San Diego, CA 92154
5140 Calle Sand Arch, 70, San Diego, CA 92154
Property Description
Welcome to 5140 Calle Sand Arch, Unit 70! Offered at $730,000, this spacious 4-bedroom, 4-bathroom condo features 1,768 square feet of comfortable living space. The thoughtfully designed floor plan includes a convenient bedroom and full bathroom on the first floor, ideal for guests, extended family, or a home office. Enjoy updated flooring and fresh interior paint, giving the home a clean, modern feel. With generous living areas and a versatile layout, this home offers both comfort and functionality. Don't miss the opportunity to make this beautiful property your own!
Features & Amenities
Property Details
Mortgage Calculator
Current Rates
Comparative Market Analysis
Residential Tier · 5 active · 5 closed
San Diego · Condominium
Listed 7.4% above the median closed sale of $680,000. Price per sqft ($413) is a 14% premium to closed comps ($362). Closed comps sold at 100% of list — strong seller's market.
Price Position
Positioned above the market — commands a premium.
Active Properties (5)
Active Comparables
| Address | City | Year | BD | BTH | SqFt | LotSz | LP/SqFt | LP | DIM | Score |
|---|---|---|---|---|---|---|---|---|---|---|
| 5232 Beachfront | San Diego | 2021 | 4 | 3 | 1,702 | 0 | $370 | $629,000 | 59 | 93 |
| 5474 Shorefront Drive | San Diego | 2022 | 4 | 4 | 1,785 | 0 | $378 | $675,000 | 23 | 91 |
| 5341 Calle Rockfish | San Diego | 2019 | 3 | 3 | 1,595 | 0 | $408 | $649,999 | 10 | 91 |
| 5310 Seacliff Place | San Diego | 2024 | 4 | 4 | 1,875 | 0 | $363 | $680,000 | 83 | 90 |
| 1205 Paseo Sea Cliff | San Diego | 2017 | 3 | 3 | 1,442 | 0 | $454 | $655,000 | 144 | 89 |
| Total: 5 · Average | 3.6 | 3.4 | 1,679.8 | 0 | $394.6 | $657,799.8 | 63.8 | |||
| Median | 1,702 | $655,000 | ||||||||
Closed Properties (5)
Closed Comparables
| Address | City | Year | Date | BD | BTH | SqFt | LotSz | LP | SP | SP/SqFt | SP/LP | DIM | Score |
|---|---|---|---|---|---|---|---|---|---|---|---|---|---|
| 1207 Paseo Seashore | San Diego | 2017 | 08/28/2026 | 4 | 4 | 2,034 | 0 | $699,999 | $690,000 | $339 | 0.99 | 43 | 94 |
| 1375 Calle Sandbar | San Diego | 2017 | 02/26/2026 | 5 | 4 | 1,769 | 0 | $649,000 | $680,000 | $384 | 1.05 | 22 | 92 |
| 5208 Surfwalk Way | San Diego | 2021 | 01/27/2026 | 4 | 4 | 1,777 | 0 | $675,000 | $660,000 | $371 | 0.98 | 120 | 91 |
| 5272 Beachfront Cove St | San Diego | 2021 | 07/08/2026 | 4 | 3 | 1,915 | 0 | $685,000 | $685,000 | $358 | 1.00 | 63 | 90 |
| 5216 Beachfront Cove St | San Diego | 2021 | 01/15/2026 | 4 | 4 | 1,875 | 0 | $675,000 | $675,000 | $360 | 1.00 | 44 | 90 |
| Total: 5 · Average | 4.2 | 3.8 | 1,874 | 0 | $678,000 | $678,000 | $362.4 | — | 58.4 | ||||
| Median | 1,875 | $680,000 | $680,000 | ||||||||||
Market Analysis
List vs Sale $/SqFt
Sale Price Trend
Days on Market
Sale vs List Price
This analysis was generated automatically from MLS data. For an in-depth, human-reviewed valuation, contact Joseph Sardella at josephsardella@gmail.com.