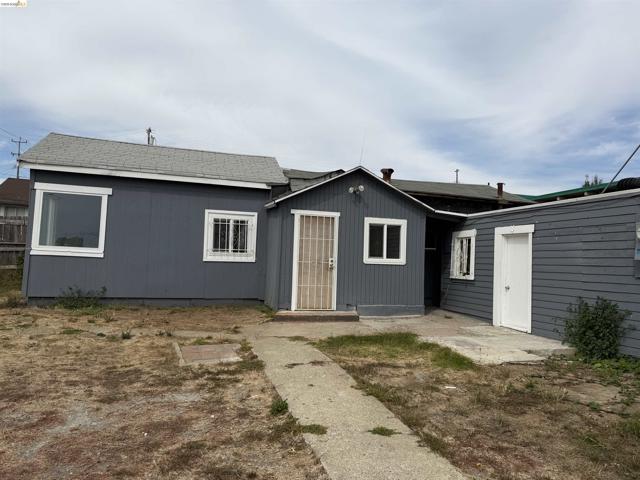
5101 Columbia Ave., Richmond, CA 94801
5101 Columbia Ave., Richmond, CA 94801
Property Description
Newly remodeled 1-bedroom, 1-bathroom single-family home, located in Richmond Annex, it's offering approximately 541 sq. ft. of living space on a generous 3,375 sq. ft. lot, an excellent opportunity for a first-time buyer, investor, or owner looking for future expansion potential, a larger home, second-story addition, or potentially a duplex, subject to zoning and required approvals. Convenient location near shopping, restaurant, Costco, Chinese 99 Ranch market, public transportation, and easy access to Highways 80 and 580. Call or text listing agent if have any questions.
Features & Amenities
Property Details
Mortgage Calculator
Current Rates
Comparative Market Analysis
Affordable Tier · 2 active · 5 closed
Richmond · Single Family Residence
Listed 8.3% below the median closed sale of $435,000. Price per sqft ($738) is a 50% premium to closed comps ($493). Closed comps sold at 100% of list — strong seller's market.
Price Position
Priced below the market — value advantage over the field.
Active Properties (2)
Active Comparables
| Address | City | Year | BD | BTH | SqFt | LotSz | LP/SqFt | LP | DIM | Score |
|---|---|---|---|---|---|---|---|---|---|---|
| 331 50Th St | Richmond | 1941 | 2 | 1 | 778 | 5,376 | $438 | $341,000 | 46 | 64 |
| 426 34Th St | Richmond | 1956 | 3 | 1 | 892 | 2,625 | $392 | $350,000 | 3 | 53 |
| Total: 2 · Average | 2.5 | 1.0 | 835 | 4,000.5 | $415 | $345,500 | 24.5 | |||
| Median | 892 | $350,000 | ||||||||
Closed Properties (5)
Closed Comparables
| Address | City | Year | Date | BD | BTH | SqFt | LotSz | LP | SP | SP/SqFt | SP/LP | DIM | Score |
|---|---|---|---|---|---|---|---|---|---|---|---|---|---|
| 143 42nd ST | Richmond | 1946 | 07/14/2026 | 2 | 1 | 779 | 3,659 | $467,999 | $440,000 | $565 | 0.94 | 15 | 61 |
| 800 45Th St | Richmond | 1943 | 07/01/2026 | 3 | 1 | 894 | 5,940 | $495,000 | $435,000 | $487 | 0.88 | 54 | 59 |
| 1530 Maine Ave | Richmond | 1942 | 09/15/2026 | 2 | 1 | 827 | 5,150 | $349,950 | $360,000 | $435 | 1.03 | 259 | 56 |
| 249 13Th St | Richmond | 1945 | 04/22/2026 | 2 | 1 | 811 | 5,000 | $359,999 | $416,000 | $513 | 1.16 | 90 | 50 |
| 335 26Th St | Richmond | 1957 | 06/04/2026 | 2 | 1 | 961 | 2,825 | $439,900 | $446,000 | $464 | 1.01 | 45 | 50 |
| Total: 5 · Average | 2.2 | 1.0 | 854.4 | 4,514.8 | $419,400 | $419,400 | $492.8 | — | 92.6 | ||||
| Median | 827 | $435,000 | $435,000 | ||||||||||
Market Analysis
List vs Sale $/SqFt
Sale Price Trend
Days on Market
Sale vs List Price
This analysis was generated automatically from MLS data. For an in-depth, human-reviewed valuation, contact Joseph Sardella at josephsardella@gmail.com.