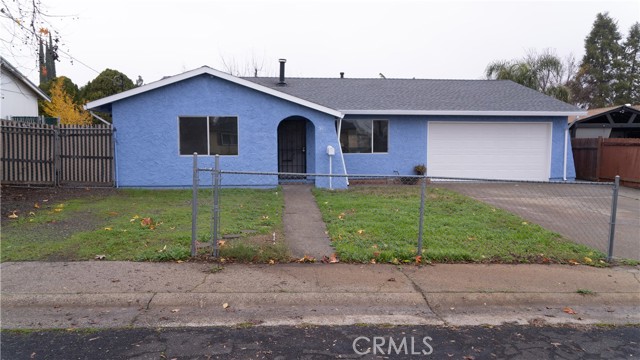
50 Rosita Way, Oroville, CA 95966
50 Rosita Way, Oroville, CA 95966
Property Description
50 Rosita Way, Oroville welcomes you with 2,644 sq. ft. of comfortable living space, featuring 4 bedrooms and 2 bathrooms designed for everyday living. Recent updates include a new roof, new flooring throughout the bedrooms, and fresh interior paint, offering a clean and refreshed feel throughout the home. The layout flows well for daily routines, with an attached garage providing added convenience. Step outside to a large backyard, ideal for relaxing, entertaining, gardening, or creating your own outdoor space over time. Situated in an established neighborhood near local schools, this home offers a practical location with room to settle in and truly make it your own.
Features & Amenities
Property Details
Mortgage Calculator
Current Rates
Comparative Market Analysis
Affordable Tier · 5 active · 5 closed
Oroville · Single Family Residence
Listed 6.3% above the median closed sale of $319,000. Price per sqft ($128) is a 48% discount to closed comps ($248). Closed comps sold at 102% of list — strong seller's market.
Price Position
Positioned above the market — commands a premium.
Active Properties (5)
Active Comparables
| Address | City | Year | BD | BTH | SqFt | LotSz | LP/SqFt | LP | DIM | Score |
|---|---|---|---|---|---|---|---|---|---|---|
| 42 Rosita Way | Oroville | 1964 | 3 | 2 | 1,132 | 7,405 | $314 | $355,000 | 191 | 78 |
| 5354 Walmer Road | Oroville | 1955 | 3 | 2 | 1,179 | 4,792 | $254 | $300,000 | 27 | 73 |
| 15 Regent Loop | Oroville | 1963 | 4 | 2 | 1,300 | 8,276 | $273 | $355,000 | 145 | 69 |
| 2421 Monte Vista Avenue | Oroville | 1946 | 5 | 3 | 1,500 | 158,123 | $210 | $315,000 | 83 | 68 |
| 3398 Morningside Drive | Oroville | 1961 | 3 | 2 | 1,518 | 28,750 | $208 | $315,000 | 175 | 65 |
| Total: 5 · Average | 3.6 | 2.2 | 1,325.8 | 41,469.2 | $251.8 | $328,000 | 124.2 | |||
| Median | 1,300 | $315,000 | ||||||||
Closed Properties (5)
Closed Comparables
| Address | City | Year | Date | BD | BTH | SqFt | LotSz | LP | SP | SP/SqFt | SP/LP | DIM | Score |
|---|---|---|---|---|---|---|---|---|---|---|---|---|---|
| 5594 Lower Wyandotte | Oroville | 1980 | 09/11/2026 | 3 | 3 | 2,203 | 23,958 | $309,000 | $327,000 | $148 | 1.06 | 53 | 76 |
| 5259 Farley Street | Oroville | 1955 | 08/25/2026 | 3 | 2 | 1,066 | 8,276 | $297,000 | $302,000 | $283 | 1.02 | 68 | 75 |
| 5725 Lower Wyandotte Rd | Oroville | 1975 | 05/27/2026 | 3 | 2 | 1,138 | 8,712 | $339,000 | $355,000 | $312 | 1.05 | 50 | 73 |
| 2941 Oro Bangor | Oroville | 1960 | 10/23/2026 | 3 | 2 | 1,194 | 20,909 | $289,900 | $290,000 | $243 | 1.00 | 141 | 69 |
| 5215 Ve Avenue | Oroville | 1961 | 06/15/2026 | 3 | 2 | 1,250 | 21,780 | $319,000 | $319,000 | $255 | 1.00 | 54 | 68 |
| Total: 5 · Average | 3.0 | 2.2 | 1,370.2 | 16,727 | $318,600 | $318,600 | $248.2 | — | 73.2 | ||||
| Median | 1,194 | $319,000 | $319,000 | ||||||||||
Market Analysis
List vs Sale $/SqFt
Sale Price Trend
Days on Market
Sale vs List Price
This analysis was generated automatically from MLS data. For an in-depth, human-reviewed valuation, contact Joseph Sardella at josephsardella@gmail.com.