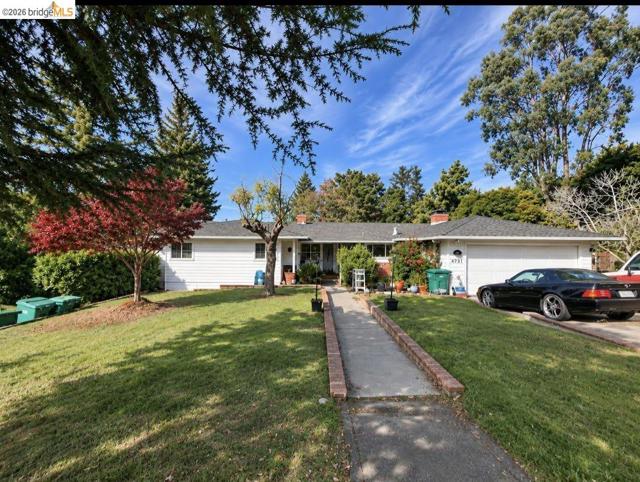
4731 Lowrey Rd, Oakland, CA 94605
4731 Lowrey Rd, Oakland, CA 94605
Property Description
Incredible opportunity in the beautiful and serene Chabot Park neighborhood of the Oakland Hills! Situated on a quiet cul-de-sac on an expansive 0.54-acre lot, this property offers privacy, tranquility, and tremendous potential. The home needs TLC, presenting an exciting opportunity to renovate, personalize, and create something truly special. The basement features several additional rooms offering flexible possibilities. Mature fruit trees complement the property's peaceful natural setting. Bring your vision and creativity to transform this property into something extraordinary! Open House Saturday, 11/21/26 from 2:00 to 4:30 PM.
Features & Amenities
Property Details
Mortgage Calculator
Current Rates
Comparative Market Analysis
Residential Tier · 5 active · 5 closed
Oakland · Single Family Residence
Listed 6.8% below the median closed sale of $750,000. Price per sqft ($360) is a 24% discount to closed comps ($473). Closed comps sold at 104% of list — strong seller's market.
Price Position
Priced below the market — value advantage over the field.
Active Properties (5)
Active Comparables
| Address | City | Year | BD | BTH | SqFt | LotSz | LP/SqFt | LP | DIM | Score |
|---|---|---|---|---|---|---|---|---|---|---|
| 10600 Sheldon St | Oakland | 1949 | 3 | 1 | 1,200 | 5,920 | $521 | $625,000 | 16 | 63 |
| 2515 Oliver Ave | Oakland | 1959 | 3 | 2 | 1,352 | 3,000 | $499 | $675,000 | 61 | 61 |
| 9108 Golf Links | Oakland | 1973 | 4 | 2 | 1,572 | 4,280 | $419 | $659,000 | 165 | 56 |
| 2275 Washington Ave | San Leandro | 1951 | 3 | 1 | 1,696 | 5,905 | $353 | $599,000 | 137 | 54 |
| 4117 Seacor Ct | Oakland | 1946 | 3 | 1 | 1,104 | 5,925 | $543 | $599,000 | 16 | 53 |
| Total: 5 · Average | 3.2 | 1.4 | 1,384.8 | 5,006 | $467 | $631,400 | 79 | |||
| Median | 1,352 | $625,000 | ||||||||
Closed Properties (5)
Closed Comparables
| Address | City | Year | Date | BD | BTH | SqFt | LotSz | LP | SP | SP/SqFt | SP/LP | DIM | Score |
|---|---|---|---|---|---|---|---|---|---|---|---|---|---|
| 10840 Golf Links Rd | Oakland | 1955 | 08/31/2026 | 3 | 2 | 1,510 | 6,100 | $649,950 | $750,000 | $497 | 1.15 | 27 | 78 |
| 9 Leamont Court | Oakland | 1959 | 11/24/2025 | 3 | 2 | 1,959 | 7,224 | $699,000 | $800,000 | $408 | 1.14 | 25 | 74 |
| 10910 Glen Artney St | Oakland | 1957 | 11/26/2025 | 3 | 2 | 1,334 | 6,000 | $769,000 | $730,000 | $547 | 0.95 | 23 | 72 |
| 10000 Sigourney Ave | Oakland | 1958 | 04/29/2026 | 3 | 2 | 1,472 | 6,580 | $795,000 | $760,000 | $516 | 0.96 | 41 | 66 |
| 3400 Mirasol Ave | Oakland | 1937 | 06/01/2026 | 3 | 2 | 1,760 | 6,370 | $688,000 | $700,000 | $398 | 1.02 | 106 | 63 |
| Total: 5 · Average | 3.0 | 2.0 | 1,607 | 6,454.8 | $748,000 | $748,000 | $473.2 | — | 44.4 | ||||
| Median | 1,510 | $750,000 | $750,000 | ||||||||||
Market Analysis
List vs Sale $/SqFt
Sale Price Trend
Days on Market
Sale vs List Price
This analysis was generated automatically from MLS data. For an in-depth, human-reviewed valuation, contact Joseph Sardella at josephsardella@gmail.com.