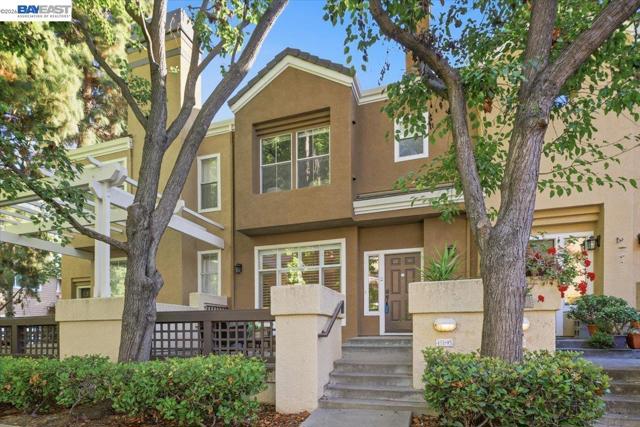
433 Camille Cir, 15, San Jose, CA 95134
433 Camille Cir, 15, San Jose, CA 95134
Property Description
Nestled in Silicon Valley Hub, Desirable Parkside Complex at River Oaks! Take delight in this beautiful remodeled townhome featuring outstanding upgrades! Enjoy chef kitchen with SS appliances, formal living room & dining, family room off kitchen and spacious bonus room. Other outstanding features include beautiful Hickory hand-scraped engineered wood & porcelain tile floors, remodeled bathrooms, recessed lights, high/vaulted ceilings, and skylights. Prime Silicon Valley location surrounded by numerous high-tech industries, commute routes (Montague Expressway, Hwy 880, etc.), Rivermark Village & River Oaks Plaza dining/shopping and many more. Walk to Starbucks right around the corner. Easy access to Coyote Creek Trail! A must see!
Features & Amenities
Property Details
Mortgage Calculator
Current Rates
Comparative Market Analysis
Residential Tier · 0 active · 5 closed
Other · San Jose · Townhouse
Listed 6.7% below the median closed sale of $1,500,145. Closed comps sold at 102% of list — strong seller's market. Expect a longer timeline — comps averaged 377 days on market.
Price Position
Priced below the market — value advantage over the field.
Closed Properties (5)
Closed Comparables
| Address | City | Year | Date | BD | BTH | SqFt | LotSz | LP | SP | SP/SqFt | SP/LP | DIM | Score |
|---|---|---|---|---|---|---|---|---|---|---|---|---|---|
| 1369 Coyote Creek Way | Milpitas | 2013 | 04/27/2026 | 3 | 4 | 1,788 | 1,488 | $1.29M | $1.29M | $724 | 1.00 | 39 | 79 |
| 1962 Journey Street | Milpitas | 2025 | 05/28/2026 | 3 | 4 | 1,886 | 0 | $1.46M | $1.50M | $795 | 1.02 | 485 | 68 |
| 1966 Journey Street | Milpitas | 2025 | 05/27/2026 | 3 | 4 | 1,886 | 0 | $1.45M | $1.40M | $741 | 0.96 | 310 | 68 |
| 1978 Journey Street | Milpitas | 2024 | 04/29/2026 | 3 | 4 | 1,886 | 0 | $1.48M | $1.59M | $843 | 1.07 | 518 | 68 |
| 1980 Journey Street | Milpitas | 2024 | 04/24/2026 | 3 | 4 | 1,886 | 0 | $1.48M | $1.54M | $817 | 1.04 | 534 | 68 |
| Total: 5 · Average | 3.0 | 4.0 | 1,866.4 | 1,488 | $1.46M | $1.46M | $784 | — | 377.2 | ||||
| Median | 1,886 | $1.50M | $1.50M | ||||||||||
Market Analysis
List vs Sale $/SqFt
Sale Price Trend
Days on Market
Sale vs List Price
This analysis was generated automatically from MLS data. For an in-depth, human-reviewed valuation, contact Joseph Sardella at josephsardella@gmail.com.