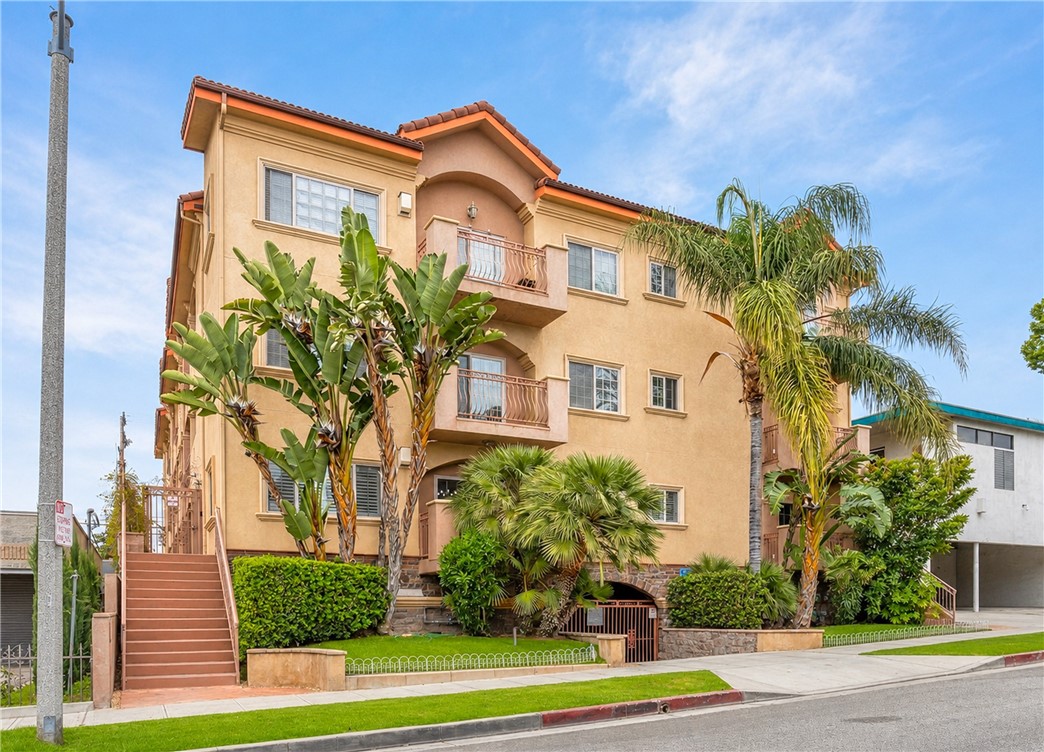
421 East Santa Anita, 301, Burbank, CA 91501
421 East Santa Anita, 301, Burbank, CA 91501
Property Description
Awesome Burbank Hills Remodeled Condo with Breath Taking Views of the Valley. This Unique Top Floor Front Corner Unit with Only 1 Shared Wall offers 3 Bedroom, 3 Bathroom Condo offers Spacious Living Room with Fireplace, Recessed Lighting and City Views. The Kitchen was Remodeled with all new Cabinets, Stainless Steel Sink and Stone Counters. The Primary Bedroom offers a Primary Bathroom, Walk In Closet & Balcony. The Unit also offers Laminate Wood Flooring & Tile throughout, Washer & Dryer Hookups in Unit, Dual Paned Windows, Den which could be converted to a 4th Bedroom or Office, Side by Side Parking & Storage Cabinet. Building is Walking Distance to Shopping, Restaurants, Close to Freeway Access & Rooftop Deck for BBQ's or Gatherings. This is a must see!
Features & Amenities
Property Details
Mortgage Calculator
Current Rates
Comparative Market Analysis
Affordable Tier · 5 active · 5 closed
Burbank · Condominium
Listed 11.7% above the median closed sale of $715,000.
Price Position
Positioned above the market — commands a premium.
Active Properties (5)
Active Comparables
| Address | City | Year | BD | BTH | SqFt | LotSz | LP/SqFt | LP | DIM | Score |
|---|---|---|---|---|---|---|---|---|---|---|
| 250 1st Street | Burbank | 2007 | 2 | 3 | 1,380 | 0 | $630 | $870,000 | 92 | 84 |
| 700 San Fernando Boulevard | Burbank | 2006 | 2 | 2 | 1,380 | 15,709 | $572 | $789,000 | 23 | 82 |
| 610 Harvard Road | Burbank | 1989 | 3 | 3 | 1,274 | 7,474 | $604 | $769,000 | 23 | 81 |
| 554 San Jose Avenue | Burbank | 1990 | 3 | 3 | 1,763 | 8,723 | $470 | $829,000 | 38 | 81 |
| 569 Tujunga Avenue | Burbank | 1981 | 2 | 3 | 1,485 | 7,494 | $556 | $825,000 | 25 | 79 |
| Total: 5 · Average | 2.4 | 2.8 | 1,456.4 | 9,850 | $566.4 | $816,400 | 40.2 | |||
| Median | 1,380 | $825,000 | ||||||||
Closed Properties (5)
Closed Comparables
| Address | City | Year | Date | BD | BTH | SqFt | LotSz | LP | SP | SP/SqFt | SP/LP | DIM | Score |
|---|---|---|---|---|---|---|---|---|---|---|---|---|---|
| 715 Angeleno | Burbank | 2005 | 10/06/2026 | 3 | 3 | 1,420 | 7,386 | $915,000 | $915,000 | $644 | 1.00 | 15 | 88 |
| 626 Orange Grove Avenue | Burbank | 2005 | 09/16/2026 | 3 | 3 | 1,200 | 15,273 | $748,000 | $715,000 | $596 | 0.96 | 128 | 85 |
| 626 Orange Grove Avenue | Burbank | 2005 | 09/29/2026 | 2 | 3 | 989 | 15,268 | $720,000 | $690,000 | $698 | 0.96 | 113 | 82 |
| 710 San Fernando Boulevard | Burbank | 2006 | 11/24/2025 | 3 | 2 | 1,380 | 15,709 | $859,000 | $875,000 | $634 | 1.02 | 59 | 80 |
| 619 Elmwood Avenue | Burbank | 1978 | 09/01/2026 | 2 | 2 | 1,255 | 16,884 | $739,000 | $704,000 | $561 | 0.95 | 95 | 78 |
| Total: 5 · Average | 2.6 | 2.6 | 1,248.8 | 14,104 | $779,800 | $779,800 | $626.6 | — | 82 | ||||
| Median | 1,255 | $715,000 | $715,000 | ||||||||||
Market Analysis
List vs Sale $/SqFt
Sale Price Trend
Days on Market
Sale vs List Price
This analysis was generated automatically from MLS data. For an in-depth, human-reviewed valuation, contact Joseph Sardella at josephsardella@gmail.com.