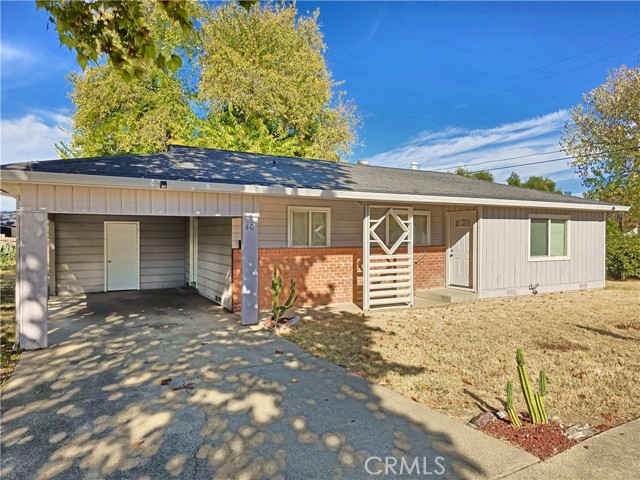
40 Sandy Way, Red Bluff, CA 96080
40 Sandy Way, Red Bluff, CA 96080
Property Description
Fresh, updated, and priced to sell, this 2-bedroom, 1-bath single family home is waiting for its new owner. The interior has been refreshed with a renovated kitchen and a renovated bathroom that give every room a clean, bright, move-in-ready feel and make it easy to picture your own style settling in. A dedicated laundry room inside creates conveniency, and the covered carport gives you protected parking while the storage shed handles the tools, bikes, and seasonal gear. Then step outside to the real prize, a really big backyard with room for gatherings, a garden, pets, or whatever you have been dreaming up. Whether you are a first-time buyer ready to stop renting, someone looking to downsize without sacrificing outdoor space, or an investor searching for a great opportunity, this home delivers real value. Buyers to verify any and all information to their satisfaction.
Features & Amenities
Property Details
Mortgage Calculator
Current Rates
Comparative Market Analysis
Affordable Tier · 1 active · 5 closed
Red Bluff · Single Family Residence
Listed 4.4% below the median closed sale of $225,000. Price per sqft ($226) is a 12% premium to closed comps ($202). Closed comps sold at 102% of list — strong seller's market. Expect a longer timeline — comps averaged 132 days on market.
Price Position
Aligned with the market — fair pricing for the comps.
Active Properties (1)
Active Comparables
| Address | City | Year | BD | BTH | SqFt | LotSz | LP/SqFt | LP | DIM | Score |
|---|---|---|---|---|---|---|---|---|---|---|
| 1515 Derby Road | Red Bluff | 1930 | 2 | 1 | 1,672 | 56,628 | $147 | $245,000 | 181 | 57 |
| Total: 1 · Average | 2.0 | 1.0 | 1,672 | 56,628 | $147 | $245,000 | 181 | |||
| Median | 1,672 | $245,000 | ||||||||
Closed Properties (5)
Closed Comparables
| Address | City | Year | Date | BD | BTH | SqFt | LotSz | LP | SP | SP/SqFt | SP/LP | DIM | Score |
|---|---|---|---|---|---|---|---|---|---|---|---|---|---|
| 524 Madison Street | Red Bluff | 1910 | 10/07/2026 | 2 | 1 | 900 | 4,356 | $190,000 | $190,000 | $211 | 1.00 | 44 | 84 |
| 1160 Orange Street | Red Bluff | 1961 | 05/11/2026 | 3 | 1 | 1,166 | 81,457 | $249,000 | $245,000 | $210 | 0.98 | 245 | 74 |
| 126 Mary Lane | Red Bluff | 1953 | 07/17/2026 | 3 | 1 | 1,218 | 12,499 | $229,000 | $245,000 | $201 | 1.07 | 36 | 73 |
| 1209 Aloha Street | Red Bluff | 1983 | 11/21/2025 | 3 | 1 | 1,062 | 6,624 | $217,000 | $217,000 | $204 | 1.00 | 125 | 71 |
| 1359 2nd | Red Bluff | 1915 | 07/01/2026 | 3 | 1 | 1,221 | 5,867 | $214,950 | $225,000 | $184 | 1.05 | 212 | 68 |
| Total: 5 · Average | 2.8 | 1.0 | 1,113.4 | 22,160.6 | $224,400 | $224,400 | $202 | — | 132.4 | ||||
| Median | 1,166 | $225,000 | $225,000 | ||||||||||
Market Analysis
List vs Sale $/SqFt
Sale Price Trend
Days on Market
Sale vs List Price
This analysis was generated automatically from MLS data. For an in-depth, human-reviewed valuation, contact Joseph Sardella at josephsardella@gmail.com.