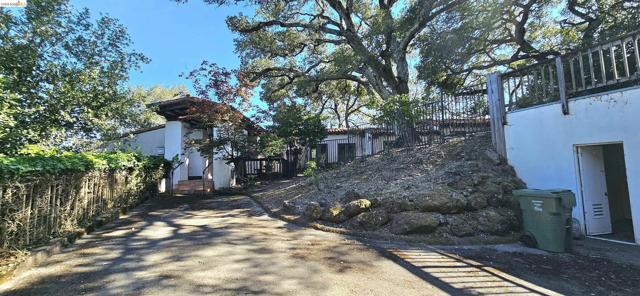
40 Hilldale Ct, Orinda, CA 94563
40 Hilldale Ct, Orinda, CA 94563
Property Description
Come see this gorgeous, gated estate offering Mediterranean features and old-world character, situated on an expansive 5.78-acre lot for exclusive privacy or potential development (CA SB 9). This home is ready to be restored or re-imagined, featuring two primary suites on separate wings, a sun-soaked living room with wood-burning fireplace, and a beautiful chef’s kitchen that leads into a wrap-around deck, perfect for morning coffee and serene valley views. At the heart of the property sits a spacious courtyard with an in-ground pool, pavillion and garden access, ideal for hosting events and outdoor lounging. This is a rare opportunity to secure an exclusive estate in the Lost Hills neighborhood. Whether you recapture the classic charm or customize to your own vision, don’t miss your chance to book your showing! Views: Ridge
Features & Amenities
Property Details
Mortgage Calculator
Current Rates
Comparative Market Analysis
Luxury Tier · 0 active · 5 closed
Orinda · Single Family Residence
Listed in line with the median closed sale of $2,007,913. Luxury tier — fewer comparable sales widen the confidence range.
Price Position
Aligned with the market — fair pricing for the comps.
Closed Properties (5)
Closed Comparables
| Address | City | Year | Date | BD | BTH | SqFt | LotSz | LP | SP | SP/SqFt | SP/LP | DIM | Score |
|---|---|---|---|---|---|---|---|---|---|---|---|---|---|
| 257 Orchard Rd | Orinda | 1948 | 04/20/2026 | 4 | 4 | 2,609 | 22,216 | $2.00M | $2.01M | $770 | 1.01 | 31 | 58 |
| 33 Altamount Drive | Orinda | 1952 | 01/30/2026 | 5 | 4 | 4,340 | 18,720 | $2.19M | $2.10M | $484 | 0.96 | 39 | 52 |
| 202 Glorietta Blvd | Orinda | 1948 | 06/24/2026 | 5 | 3 | 3,309 | 16,800 | $2.17M | $2.23M | $672 | 1.02 | 26 | 51 |
| 19 Valley Dr | Orinda | 1955 | 08/21/2026 | 4 | 3 | 2,741 | 17,415 | $1.88M | $1.79M | $653 | 0.95 | 57 | 51 |
| 231 Orchard Rd | Orinda | 1952 | 12/16/2025 | 4 | 4 | 3,231 | 28,750 | $2.00M | $1.90M | $588 | 0.95 | 136 | 48 |
| Total: 5 · Average | 4.4 | 3.6 | 3,246 | 20,780.2 | $2.00M | $2.00M | $633.4 | — | 57.8 | ||||
| Median | 3,231 | $2.01M | $2.01M | ||||||||||
Market Analysis
List vs Sale $/SqFt
Sale Price Trend
Days on Market
Sale vs List Price
This analysis was generated automatically from MLS data. For an in-depth, human-reviewed valuation, contact Joseph Sardella at josephsardella@gmail.com.