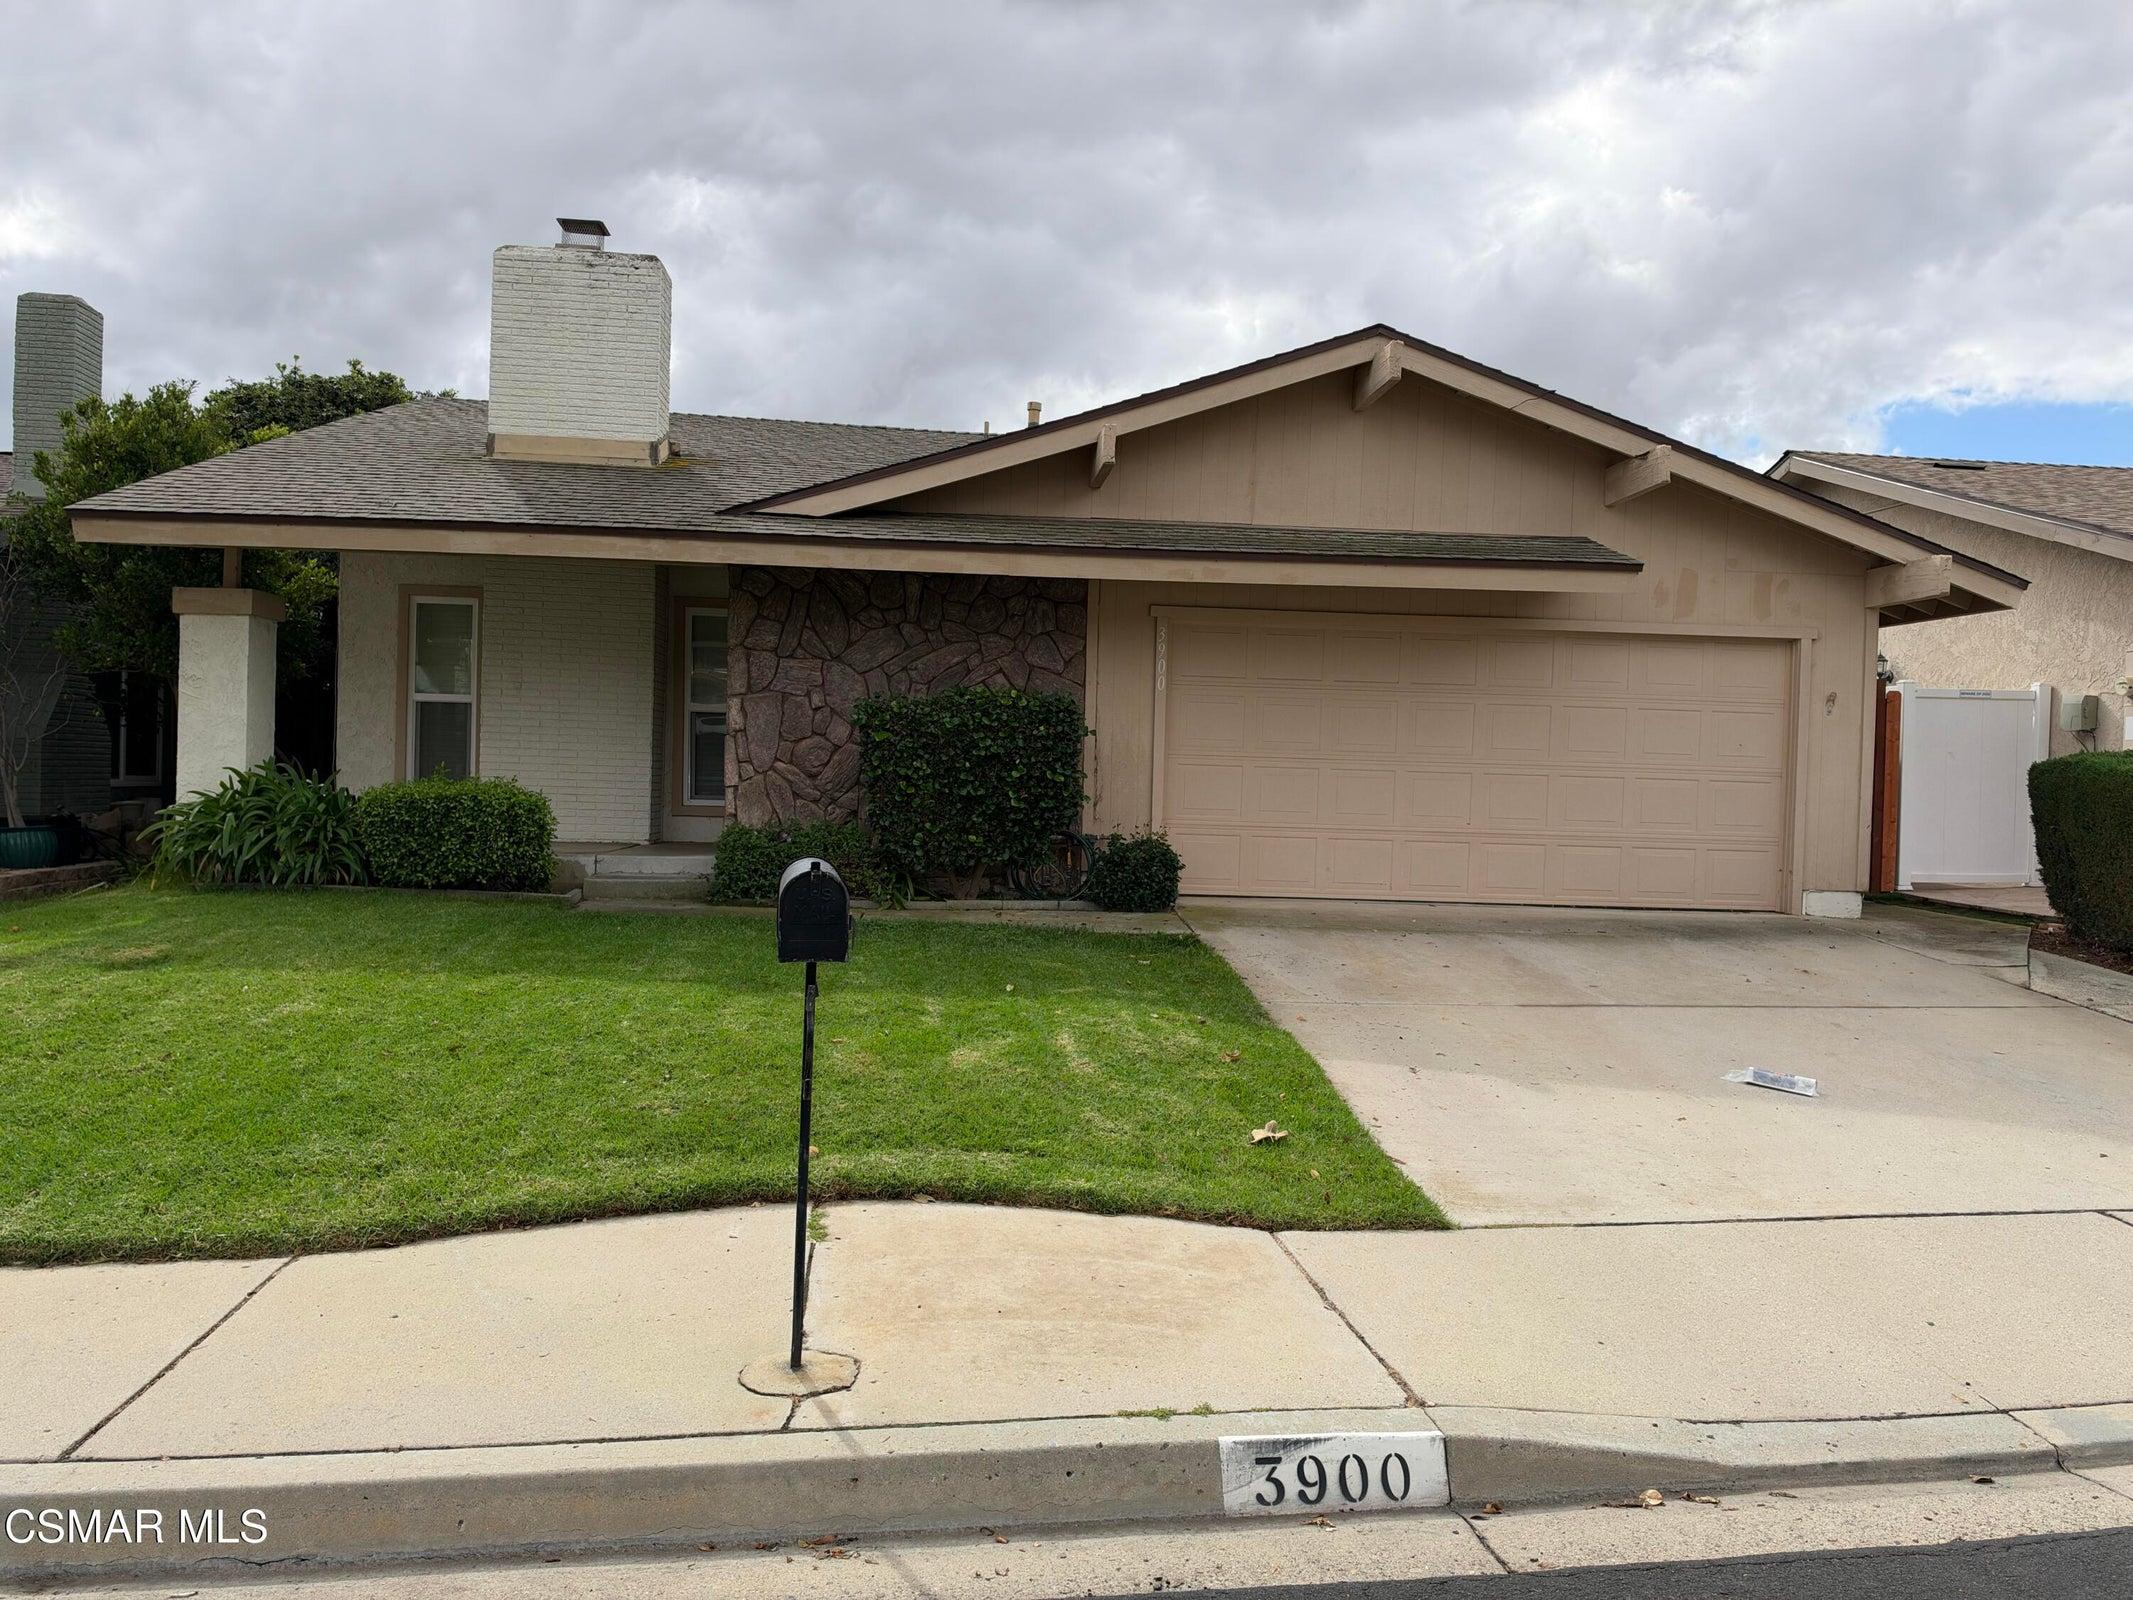
3900 San Clemente Court, Newbury Park, CA 91320
3900 San Clemente Court, Newbury Park, CA 91320
Property Description
Great home in an amazing neighborhood. Everything around it has sold or is selling for $1,000,000+. Completely freshly painted throughout. Washer, Dryer and refrigerator are included. Updated dual pane windows. Newer A/C and water heater. Newer roof. Community pool, spa, play ground set and pickle ball and tennis court. Close to schools, freeways and shopping but far enough to be quiet. Vacant and ready for immediate occupancy.
Features & Amenities
Property Details
Mortgage Calculator
Current Rates
Comparative Market Analysis
Affordable Tier · 5 active · 5 closed
Newbury Park · Single Family Residence
Listed 6.4% above the median closed sale of $846,000. Price per sqft ($680) is a 17% premium to closed comps ($583).
Price Position
Positioned above the market — commands a premium.
Active Properties (5)
Active Comparables
| Address | City | Year | BD | BTH | SqFt | LotSz | LP/SqFt | LP | DIM | Score |
|---|---|---|---|---|---|---|---|---|---|---|
| 3599 Cordova Court | Newbury Park | 1976 | 3 | 2 | 1,388 | 8,038 | $645 | $895,000 | 26 | 89 |
| 3586 Cordova Court | Newbury Park | 1975 | 3 | 2 | 1,441 | 5,000 | $607 | $875,000 | 8 | 89 |
| 3599 Cordova Court | Newbury Park | 1976 | 3 | 2 | 1,388 | 7,840 | $645 | $895,000 | 73 | 87 |
| 3898 Coronado Circle | Newbury Park | 1977 | 4 | 2 | 1,641 | 6,734 | $609 | $1.00M | 25 | 87 |
| 554 Dorena Drive | Newbury Park | 1964 | 3 | 2 | 1,308 | 8,276 | $669 | $875,000 | 96 | 86 |
| Total: 5 · Average | 3.2 | 2.0 | 1,433.2 | 7,177.6 | $635 | $908,000 | 45.6 | |||
| Median | 1,388 | $895,000 | ||||||||
Closed Properties (5)
Closed Comparables
| Address | City | Year | Date | BD | BTH | SqFt | LotSz | LP | SP | SP/SqFt | SP/LP | DIM | Score |
|---|---|---|---|---|---|---|---|---|---|---|---|---|---|
| 3861 Coronado Circle | Newbury Park | 1977 | 09/02/2026 | 3 | 2 | 1,605 | 6,534 | $869,000 | $875,000 | $545 | 1.01 | 18 | 89 |
| 624 Paseo Montecito | Newbury Park | 1977 | 10/07/2026 | 3 | 2 | 1,156 | 6,534 | $774,000 | $767,000 | $663 | 0.99 | 86 | 89 |
| 4032 Monterey Court | Newbury Park | 1979 | 12/09/2025 | 3 | 2 | 1,348 | 6,534 | $889,900 | $885,000 | $657 | 0.99 | 60 | 88 |
| 124 Bluefield Avenue | Thousand Oaks | 1964 | 11/06/2026 | 4 | 2 | 1,455 | 7,560 | $859,000 | $846,000 | $581 | 0.98 | 41 | 85 |
| 130 Fallbrook Avenue | Newbury Park | 1965 | 08/28/2026 | 3 | 3 | 1,693 | 6,969 | $849,000 | $795,000 | $470 | 0.94 | 17 | 77 |
| Total: 5 · Average | 3.2 | 2.2 | 1,451.4 | 6,826.2 | $833,600 | $833,600 | $583.2 | — | 44.4 | ||||
| Median | 1,455 | $846,000 | $846,000 | ||||||||||
Market Analysis
List vs Sale $/SqFt
Sale Price Trend
Days on Market
Sale vs List Price
This analysis was generated automatically from MLS data. For an in-depth, human-reviewed valuation, contact Joseph Sardella at josephsardella@gmail.com.