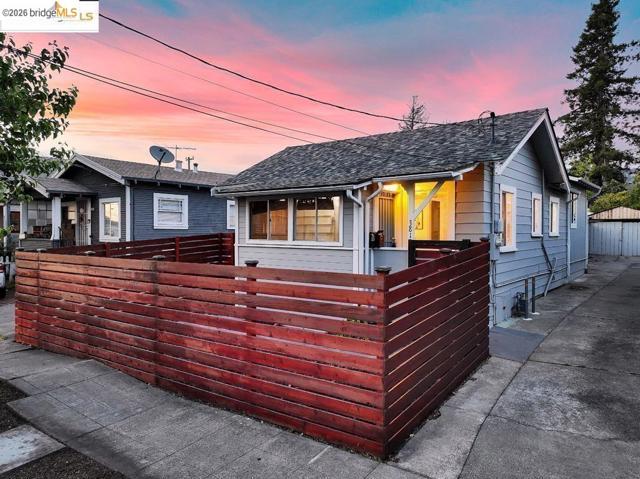
3818 Suter ST, Oakland, CA 94619
3818 Suter ST, Oakland, CA 94619
Property Description
Welcome to Oakland's Allendale District, where this 3-bedroom, 2-bath home checks every box. The updated kitchen anchors the living space with brand-new stainless steel appliances, quartz countertops, recessed LED lighting, and a center island built for morning coffee or evening entertaining. Sunlight pours through the open living areas, creating a warm, welcoming feel from room to room. Out back, a detached bonus structure is ready for your vision - home office, gym, studio, or whatever fits your life next. Being within walking distance of the Laurel District means walkable shops and restaurants, easy transit access, and quick freeway connections, putting Oakland's eclectic energy and an easy commute within reach. A rare find in one of the East Bay's most sought-after neighborhoods. County records reflect 792 sq ft, including the permitted 247 sq ft addition. Total living area and permit status of additional area have not been verified. Buyers and agents to independently investigate square footage, permits and property configuration.
Features & Amenities
Property Details
Mortgage Calculator
Current Rates
Comparative Market Analysis
Affordable Tier · 5 active · 5 closed
Oakland · Single Family Residence
Listed in line with the median closed sale of $536,000. Price per sqft ($693) is a 10% premium to closed comps ($629). Closed comps sold at 103% of list — strong seller's market.
Price Position
Aligned with the market — fair pricing for the comps.
Active Properties (5)
Active Comparables
| Address | City | Year | BD | BTH | SqFt | LotSz | LP/SqFt | LP | DIM | Score |
|---|---|---|---|---|---|---|---|---|---|---|
| 3042 Eastman Ave | Oakland | 1920 | 3 | 1 | 816 | 4,250 | $734 | $599,000 | 26 | 90 |
| 3316 Macarthur Blvd | Oakland | 1924 | 2 | 1 | 871 | 2,346 | $597 | $520,000 | 74 | 83 |
| 4117 Penniman Ct #G | Oakland | 1925 | 2 | 2 | 1,173 | 3,456 | $511 | $599,000 | 80 | 79 |
| 1960 38Th Ave | Oakland | 1911 | 2 | 1 | 843 | 3,600 | $616 | $519,500 | 22 | 78 |
| 2830 69th | Oakland | 1940 | 2 | 1 | 928 | 3,680 | $533 | $495,000 | 114 | 74 |
| Total: 5 · Average | 2.2 | 1.2 | 926.2 | 3,466.4 | $598.2 | $546,500 | 63.2 | |||
| Median | 871 | $520,000 | ||||||||
Closed Properties (5)
Closed Comparables
| Address | City | Year | Date | BD | BTH | SqFt | LotSz | LP | SP | SP/SqFt | SP/LP | DIM | Score |
|---|---|---|---|---|---|---|---|---|---|---|---|---|---|
| 4010 Masterson St | Oakland | 1920 | 02/09/2026 | 2 | 2 | 803 | 2,136 | $588,000 | $590,000 | $735 | 1.00 | 119 | 85 |
| 2921 Eastman Ave | Oakland | 1926 | 07/02/2026 | 3 | 1 | 948 | 4,130 | $449,000 | $501,000 | $528 | 1.12 | 21 | 84 |
| 2720 Short St | Oakland | 1908 | 07/23/2026 | 2 | 1 | 897 | 3,500 | $520,000 | $520,000 | $580 | 1.00 | 58 | 81 |
| 2911 Viola Street | Oakland | 1913 | 02/13/2026 | 2 | 1 | 764 | 3,000 | $515,000 | $536,000 | $702 | 1.04 | 30 | 81 |
| 3735 Nevil St | Oakland | 1911 | 08/14/2026 | 3 | 1 | 1,045 | 3,750 | $625,000 | $625,000 | $598 | 1.00 | 91 | 79 |
| Total: 5 · Average | 2.4 | 1.2 | 891.4 | 3,303.2 | $554,400 | $554,400 | $628.6 | — | 63.8 | ||||
| Median | 897 | $536,000 | $536,000 | ||||||||||
Market Analysis
List vs Sale $/SqFt
Sale Price Trend
Days on Market
Sale vs List Price
This analysis was generated automatically from MLS data. For an in-depth, human-reviewed valuation, contact Joseph Sardella at josephsardella@gmail.com.