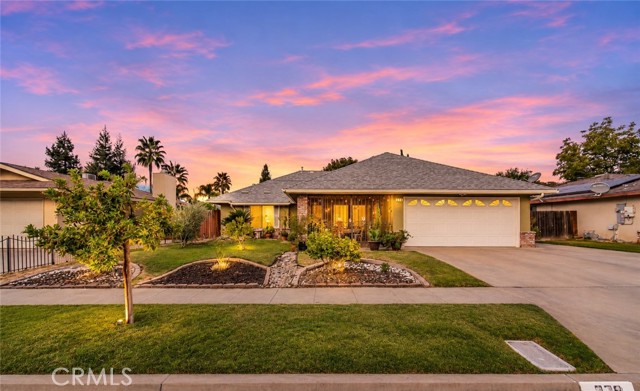
379 North Shirley, Fresno, CA 93727
379 North Shirley, Fresno, CA 93727
Property Description
Welcome home to this charming 3-bedroom, 2-bath home offering comfort, convenience, and incredible value and to top it off it's located within the Clovis Unified School District!! Featuring both a spacious living room and a separate den, this home offers plenty of room to relax, entertain, or simply spread out. Enjoy warm summer days lounging by your own private swimming pool, perfect for entertaining family and friends. Additional highlights include owned solar, helping keep energy costs down, an HVAC system that's just 2 years old, and a water heater approximately 5 years old. To make moving in even easier, the refrigerator, washer, and dryer are all included! With so many desirable features and valuable upgrades already in place, this home is ready for its next owner to move in and enjoy. Don't miss this fantastic opportunity!Some pictures have been virtually staged.
Features & Amenities
Property Details
Mortgage Calculator
Current Rates
Comparative Market Analysis
Affordable Tier · 3 active · 5 closed
Fresno · Single Family Residence
Listed 3.5% below the median closed sale of $430,000.
Price Position
Aligned with the market — fair pricing for the comps.
Active Properties (3)
Active Comparables
| Address | City | Year | BD | BTH | SqFt | LotSz | LP/SqFt | LP | DIM | Score |
|---|---|---|---|---|---|---|---|---|---|---|
| 4829 Mckenzie | Fresno | 1983 | 3 | 2 | 1,420 | 7,314 | $250 | $355,000 | 17 | 69 |
| 6589 Michigan | Fresno | 2005 | 3 | 2 | 2,005 | 6,500 | $224 | $449,000 | 156 | 63 |
| 6231 Berkeley | Fresno | 2021 | 4 | 3 | 1,835 | 4,275 | $251 | $460,000 | 23 | 63 |
| Total: 3 · Average | 3.3 | 2.3 | 1,753.333 | 6,029.667 | $241.667 | $421,333.333 | 65.33333333333333 | |||
| Median | 1,835 | $449,000 | ||||||||
Closed Properties (5)
Closed Comparables
| Address | City | Year | Date | BD | BTH | SqFt | LotSz | LP | SP | SP/SqFt | SP/LP | DIM | Score |
|---|---|---|---|---|---|---|---|---|---|---|---|---|---|
| 5840 Illinois Avenue | Fresno | 1981 | 04/10/2026 | 3 | 2 | 1,744 | 7,140 | $435,000 | $430,000 | $247 | 0.99 | 79 | 84 |
| 636 Apricot | Fresno | 2024 | 08/06/2026 | 3 | 2 | 1,535 | 4,000 | $420,000 | $415,000 | $270 | 0.99 | 49 | 78 |
| 2136 Redda Road | Fresno | 2021 | 08/21/2026 | 3 | 2 | 1,600 | 7,000 | $430,000 | $430,000 | $269 | 1.00 | 30 | 71 |
| 6928 Lane Ave | Fresno | 1980 | 07/16/2026 | 3 | 2 | 2,000 | 14,630 | $480,000 | $440,000 | $220 | 0.92 | 115 | 69 |
| 6567 Pine | Fresno | 2024 | 04/15/2026 | 4 | 2 | 1,622 | 4,080 | $475,000 | $450,000 | $277 | 0.95 | 68 | 69 |
| Total: 5 · Average | 3.2 | 2.0 | 1,700.2 | 7,370 | $433,000 | $433,000 | $256.6 | — | 68.2 | ||||
| Median | 1,622 | $430,000 | $430,000 | ||||||||||
Market Analysis
List vs Sale $/SqFt
Sale Price Trend
Days on Market
Sale vs List Price
This analysis was generated automatically from MLS data. For an in-depth, human-reviewed valuation, contact Joseph Sardella at josephsardella@gmail.com.