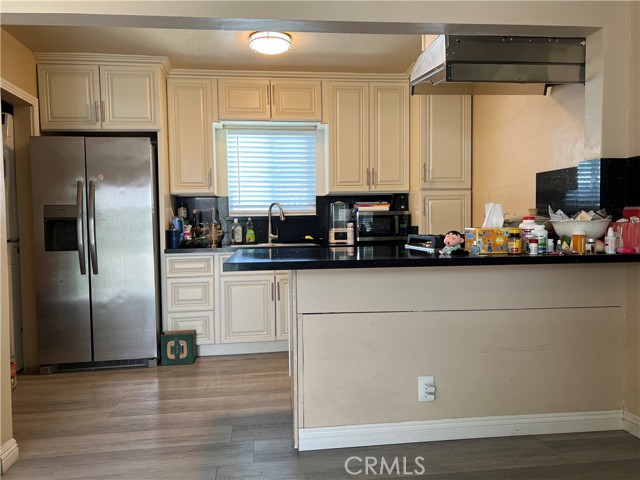
1 / 8
3722 Cypress, El Monte, CA 91731
$698K2bd · 2ba · 780 sqft
Lot 6,388 sqft•Single Family Residence•Active•57d on market•MLS# TR-26162176
3722 Cypress, El Monte, CA 91731
MLS# TR-26162176•Residential•Single Family Residence
Active57 days on market
$698,000
2
Beds
2
Baths
780
Sq Ft
6,388
Lot Sq Ft
1927
Year Built
None
View
Property Description
Zone R3. Preliminary ADU plan available with City corrections, plans are not for construction, buyers to verify with City for terms and condition for plan final approval. New remodel include all windows., kitchen, electric meters panel, AC with city permit. Property sold As It condition.
Features & Amenities
FeeBuilt 1927
Property Details
Land Type
Fee
Year Built
1927
Property Type
Residential
Property Subtype
Single Family Residence
Parking Spaces
0
Garage Spaces
0
Heating
See Remarks
Cooling
See Remarks
View
None
Flooring
See Remarks
Roof
Asphalt
City
El Monte
Zip Code
91731
County
Los Angeles
Mortgage Calculator
Current Rates
$
$
%
Monthly Payment
$3,529.47
Principal & Interest
Loan Amount
$558,400
Total Interest
$712,208
Total Payment Over 30 Years
$1,270,608
This calculator provides estimates only. Actual mortgage payments may include taxes, insurance, HOA fees, and PMI. Contact a lender for accurate quotes.
Comparative Market Analysis
Affordable Tier · 5 active · 5 closed
3722 Cypress, El Monte, CA 91731
El Monte · Single Family Residence
$698K
Affordable TierBeds
2
Baths
2
Sqft
780
Lot
6,388 sqft
Year
1927
$/Sqft
$895
Pool: No✓
View: None✓
Listed 6.9% below the median closed sale of $750,000. Price per sqft ($895) is a 30% premium to closed comps ($691). Closed comps sold at 107% of list — strong seller's market.
Price Position
Priced below the market — value advantage over the field.
Price advantage
Subject listed at $698K· $895/sqft
Total list price
Closed comps
vs closed median $750K
−$52K (−6.9%)
Active comps
vs active median $679K
+$19K (+2.8%)
Price per sqft
Closed compsinsufficient comp data
Active comps
vs active avg $/sqft $728
+$167 (+23.0%)
Active Properties (5)
Active Comparables
| Address | City | Year | BD | BTH | SqFt | LotSz | LP/SqFt | LP | DIM | Score |
|---|---|---|---|---|---|---|---|---|---|---|
| 11433 Stewart Street | El Monte | 1938 | 2 | 1 | 756 | 3,982 | $898 | $678,888 | 32 | 87 |
| 10966 Emery | El Monte | 1953 | 3 | 2 | 720 | 5,523 | $1,062 | $765,000 | 27 | 78 |
| 11314 Bodger Street | El Monte | 1944 | 3 | 2 | 1,188 | 6,626 | $556 | $660,000 | 27 | 74 |
| 11402 Basye Street | El Monte | 1943 | 3 | 1 | 1,224 | 6,269 | $531 | $650,000 | 20 | 71 |
| 11823 Basye | El Monte | 1964 | 3 | 2 | 1,166 | 5,444 | $592 | $689,999 | 88 | 65 |
| Total: 5 · Average | 2.8 | 1.6 | 1,010.8 | 5,568.8 | $727.8 | $688,777.4 | 38.8 | |||
| Median | 1,166 | $678,888 | ||||||||
Closed Properties (5)
Closed Comparables
| Address | City | Year | Date | BD | BTH | SqFt | LotSz | LP | SP | SP/SqFt | SP/LP | DIM | Score |
|---|---|---|---|---|---|---|---|---|---|---|---|---|---|
| 3834 Glen | El Monte | 1946 | 08/27/2026 | 3 | 2 | 932 | 5,497 | $600,000 | $600,000 | $644 | 1.00 | 62 | 81 |
| 3043 Nevada | El Monte | 1941 | 02/28/2026 | 2 | 1 | 988 | 6,633 | $698,888 | $780,000 | $789 | 1.12 | 44 | 74 |
| 10631 Mildred Street | El Monte | 1928 | 12/12/2025 | 2 | 2 | 1,152 | 6,636 | $625,000 | $727,250 | $631 | 1.16 | 38 | 72 |
| 11161 Basye | El Monte | 1953 | 10/06/2026 | 3 | 2 | 1,200 | 8,497 | $695,000 | $750,000 | $625 | 1.08 | 45 | 69 |
| 4577 Ranger Avenue | El Monte | 1954 | 07/24/2026 | 3 | 1 | 1,024 | 5,227 | $775,000 | $783,000 | $765 | 1.01 | 129 | 66 |
| Total: 5 · Average | 2.6 | 1.6 | 1,059.2 | 6,498 | $728,050 | $728,050 | $690.8 | — | 63.6 | ||||
| Median | 1,024 | $750,000 | $750,000 | ||||||||||
Market Analysis
List vs Sale $/SqFt
Sale Price Trend
Days on Market
Sale vs List Price
AI-generated CMA
This analysis was generated automatically from MLS data. For an in-depth, human-reviewed valuation, contact Joseph Sardella at josephsardella@gmail.com.