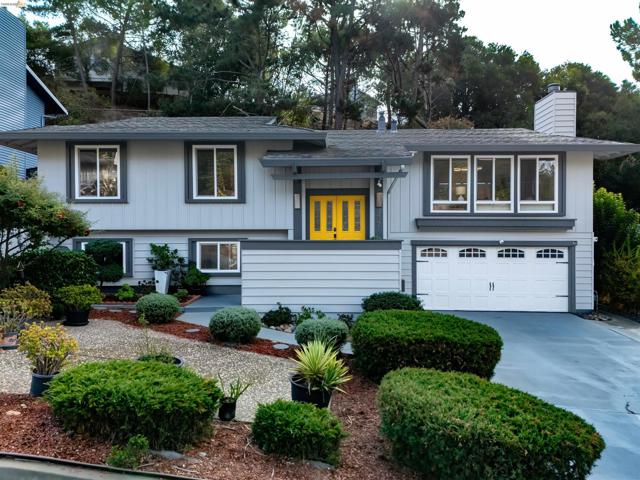
3427 Pinewood Dr, Hayward, CA
3427 Pinewood Dr, Hayward, CA
Property Description
Welcome to 3427 Pinewood Drive, nestled in the desirable Hayward Hills! Located in the established Hayward Highland neighborhood, this spacious home offers the perfect combination of comfort, convenience, and everyday living. Featuring 4 bedrooms, 3 bathrooms, and approximately 2,138 square feet of living space, the home provides a versatile layout with plenty of room to relax, entertain, and make your own. Situated on a generous 8,260-square-foot lot, the property offers ample outdoor space for entertaining, gardening, or enjoying the fresh air. Conveniently located near parks, hiking trails, shopping, dining, and major commuter routes, this home offers a wonderful opportunity to experience the best of Hayward Hills living. Don't miss your chance to make this home yours!
Features & Amenities
Property Details
Mortgage Calculator
Current Rates
About Highlands
This property is located in Highlands, a community in Hayward. Explore more listings in this neighborhood to compare options and pricing.
View Highlands ListingsComparative Market Analysis
Residential Tier · 2 active · 5 closed
Highlands · Hayward · Single Family Residence
Listed 3.5% below the median closed sale of $1,335,000. Closed comps sold at 101% of list — strong seller's market.
Price Position
Aligned with the market — fair pricing for the comps.
Active Properties (2)
Active Comparables
| Address | City | Year | BD | BTH | SqFt | LotSz | LP/SqFt | LP | DIM | Score |
|---|---|---|---|---|---|---|---|---|---|---|
| 28086 Thorup Ln | Hayward | 1987 | 4 | 3 | 2,168 | 3,850 | $530 | $1.15M | 145 | 72 |
| 24257 Ridgecreek LN | 2008 | 5 | 3 | 3,006 | 7,948 | $491 | $1.48M | 31 | 51 | |
| Total: 2 · Average | 4.5 | 3.0 | 2,587 | 5,899 | $510.5 | $1.31M | 88 | |||
| Median | 3,006 | $1.48M | ||||||||
Closed Properties (5)
Closed Comparables
| Address | City | Year | Date | BD | BTH | SqFt | LotSz | LP | SP | SP/SqFt | SP/LP | DIM | Score |
|---|---|---|---|---|---|---|---|---|---|---|---|---|---|
| 27956 Edgecliff Way | Hayward | 1968 | 02/10/2026 | 4 | 3 | 2,614 | 8,400 | $1.35M | $1.33M | $511 | 0.99 | 82 | 84 |
| 3608 Siskiyou Ct | Hayward | 1973 | 01/21/2026 | 4 | 3 | 2,552 | 9,462 | $1.30M | $1.36M | $533 | 1.05 | 41 | 83 |
| 27966 El Portal Dr | Hayward | 1972 | 06/24/2026 | 4 | 3 | 1,980 | 7,700 | $1.18M | $1.19M | $601 | 1.01 | 70 | 78 |
| 3406 Otter Ct | Hayward | 1979 | 08/31/2026 | 4 | 3 | 2,133 | 23,368 | $1.35M | $1.35M | $633 | 1.00 | 35 | 71 |
| 3414 Augusta Ct | Hayward | 1978 | 07/28/2026 | 4 | 3 | 2,133 | 20,909 | $1.20M | $1.19M | $556 | 0.99 | 55 | 71 |
| Total: 5 · Average | 4.0 | 3.0 | 2,282.4 | 13,967.8 | $1.28M | $1.28M | $566.8 | — | 56.6 | ||||
| Median | 2,133 | $1.33M | $1.33M | ||||||||||
Market Analysis
List vs Sale $/SqFt
Sale Price Trend
Days on Market
Sale vs List Price
This analysis was generated automatically from MLS data. For an in-depth, human-reviewed valuation, contact Joseph Sardella at josephsardella@gmail.com.