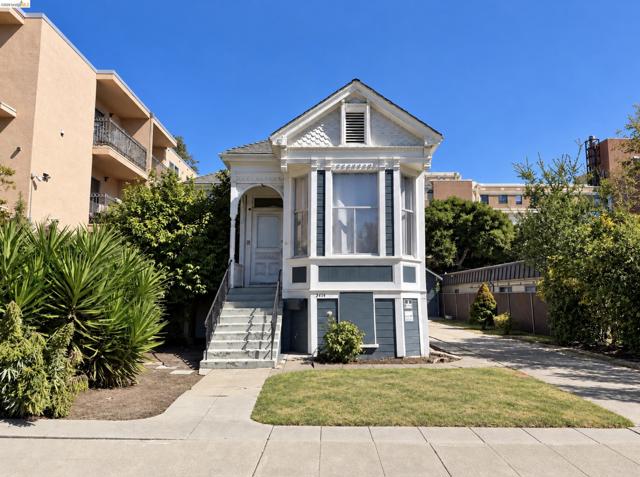
3414 Andover St, Oakland, CA
3414 Andover St, Oakland, CA
Property Description
Rare fully entitled 20-unit development opportunity in Oakland’s popular Pill Hill neighborhood. The property is fully entitled for a six story 23,996 square foot building consisting of five 2bd/2bth units, five 2bd/1bth units, and 10 1bd/1bth units. The property will offer individual decks and parking spaces for all units. The current building was built in 1903, offers 1,320 square feet of living space, and sits on a 6,000 square foot lot measuring 50’x120’. The current building has been remodeled and has a history of successful short-term rentals. The property offers a remodeled kitchen and bathroom, hard wood floors, custom molding, custom lighting, new interior paint, and more. This is an excellent opportunity for a developer to capitalize on one of Oakland’s best neighborhoods with excellent future cash flow or resale potential. This is a high demand rental surrounded by many medical centers, shopping options, restaurants, and coffee shops.
Features & Amenities
Property Details
Mortgage Calculator
Current Rates
Comparative Market Analysis
Affordable Tier · 5 active · 5 closed
Oakland · Single Family Residence
Listed 7.9% below the median closed sale of $705,000. Closed comps sold at 103% of list — strong seller's market.
Price Position
Priced below the market — value advantage over the field.
Active Properties (5)
Active Comparables
| Address | City | Year | BD | BTH | SqFt | LotSz | LP/SqFt | LP | DIM | Score |
|---|---|---|---|---|---|---|---|---|---|---|
| 842 33Rd St | Oakland | 1908 | 2 | 1 | 1,107 | 3,235 | $631 | $699,000 | 9 | 82 |
| 3326 Chestnut St | Oakland | 1888 | 4 | 1 | 1,344 | 5,096 | $520 | $699,000 | 129 | 80 |
| 331 42nd Street | Oakland | 1923 | 3 | 1 | 1,087 | 4,092 | $643 | $699,000 | 12 | 80 |
| 3520 Harrison Street | Oakland | 1895 | 3 | 3 | 1,708 | 3,788 | $369 | $630,000 | 136 | 75 |
| 915 39Th St | Oakland | 1924 | 3 | 2 | 1,561 | 3,185 | $409 | $639,000 | 142 | 73 |
| Total: 5 · Average | 3.0 | 1.6 | 1,361.4 | 3,879.2 | $514.4 | $673,200 | 85.6 | |||
| Median | 1,344 | $699,000 | ||||||||
Closed Properties (5)
Closed Comparables
| Address | City | Year | Date | BD | BTH | SqFt | LotSz | LP | SP | SP/SqFt | SP/LP | DIM | Score |
|---|---|---|---|---|---|---|---|---|---|---|---|---|---|
| 716 39Th St | Oakland | 1908 | 02/27/2026 | 3 | 2 | 1,329 | 3,300 | $710,000 | $730,000 | $549 | 1.03 | 28 | 81 |
| 3239 Adeline St | Oakland | 1895 | 10/28/2026 | 3 | 2 | 1,523 | 2,952 | $599,000 | $705,000 | $463 | 1.18 | 27 | 78 |
| 3237 Linden St | Oakland | 1893 | 01/08/2026 | 2 | 1 | 1,106 | 6,800 | $599,000 | $599,000 | $542 | 1.00 | 56 | 74 |
| 3608 Adeline St | Emeryville | 1911 | 05/08/2026 | 2 | 2 | 1,163 | 2,000 | $599,000 | $615,000 | $529 | 1.03 | 43 | 72 |
| 3873 West St | Oakland | 1913 | 08/06/2026 | 4 | 2 | 1,778 | 4,212 | $799,000 | $740,000 | $416 | 0.93 | 60 | 72 |
| Total: 5 · Average | 2.8 | 1.8 | 1,379.8 | 3,852.8 | $677,800 | $677,800 | $499.8 | — | 42.8 | ||||
| Median | 1,329 | $705,000 | $705,000 | ||||||||||
Market Analysis
List vs Sale $/SqFt
Sale Price Trend
Days on Market
Sale vs List Price
This analysis was generated automatically from MLS data. For an in-depth, human-reviewed valuation, contact Joseph Sardella at josephsardella@gmail.com.