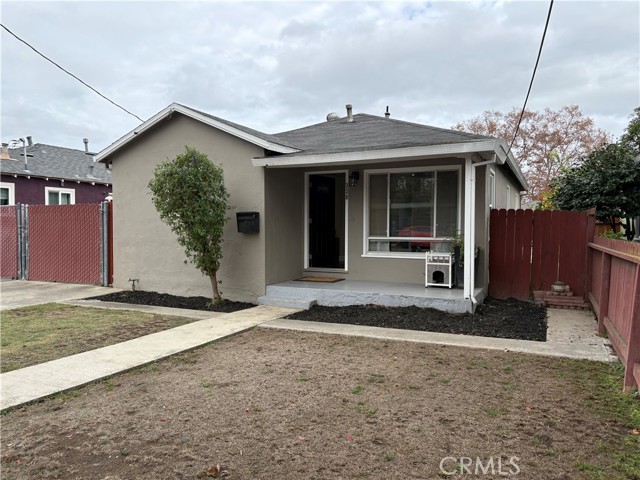
338 South 19th, San Jose, CA 95116
338 South 19th, San Jose, CA 95116
Property Description
Olinder Charmer, Steps from Naglee Park. Completely updated charming home on tree-lined street in San Jose's Olinder neighborhood — just steps from Naglee Park neighborhood and its cafés and historic streets! The heavy lifting is already done! A 2018 remodel brought a new kitchen, a fully updated bathroom, new flooring throughout, updated HVAC system, updated plumbing and electrical, etc. While more recently a newer tankless water heater adds everyday efficiency. Set on a generous 5,200 sq ft lot (968 sq ft of living space per appraiser), the property offers a LARGE backyard, plus potential to expand (buyer to verify with the city). Move-in ready, with the MAJOR improvements behind you! And only moments from Coyote Creek at William Street Park, a short drive to San José State University, and downtown San Jose and the renowned SAP Center, to mention a few. Whether you're buying your first home, right-sizing, or looking for a long-term opportunity with room to expand (buyer to verify with the city), this one is worth a look!
Features & Amenities
Property Details
Mortgage Calculator
Current Rates
Comparative Market Analysis
Affordable Tier · 1 active · 5 closed
San Jose · Single Family Residence
Listed 3.8% below the median closed sale of $920,000. Price per sqft ($914) is a 26% premium to closed comps ($725). Closed comps sold at 101% of list — strong seller's market.
Price Position
Aligned with the market — fair pricing for the comps.
Active Properties (1)
Active Comparables
| Address | City | Year | BD | BTH | SqFt | LotSz | LP/SqFt | LP | DIM | Score |
|---|---|---|---|---|---|---|---|---|---|---|
| 1307 Cathay Dr | San Jose | 1961 | 3 | 2 | 960 | 5,000 | $832 | $799,000 | 83 | 76 |
| Total: 1 · Average | 3.0 | 2.0 | 960 | 5,000 | $832 | $799,000 | 83 | |||
| Median | 960 | $799,000 | ||||||||
Closed Properties (5)
Closed Comparables
| Address | City | Year | Date | BD | BTH | SqFt | LotSz | LP | SP | SP/SqFt | SP/LP | DIM | Score |
|---|---|---|---|---|---|---|---|---|---|---|---|---|---|
| 13602 Marmont Way | San Jose | 1952 | 06/29/2026 | 3 | 1 | 1,056 | 5,040 | $899,000 | $930,000 | $881 | 1.03 | 26 | 72 |
| 1518 Denali Way | San Jose | 1978 | 08/05/2026 | 3 | 2 | 1,007 | 5,995 | $849,000 | $900,000 | $894 | 1.06 | 41 | 64 |
| 1557 Hermocilla Way | San Jose | 1999 | 07/16/2026 | 3 | 3 | 1,491 | 2,700 | $950,000 | $900,000 | $604 | 0.95 | 112 | 58 |
| 2629 Sherlock Drive | San Jose | 1967 | 05/12/2026 | 3 | 2 | 1,288 | 6,264 | $990,000 | $1.00M | $776 | 1.01 | 13 | 51 |
| 334 Virginia | Glendora | 1954 | 10/22/2026 | 3 | 2 | 1,959 | 9,100 | $925,000 | $920,000 | $470 | 0.99 | 85 | 50 |
| Total: 5 · Average | 3.0 | 2.0 | 1,360.2 | 5,819.8 | $930,000 | $930,000 | $725 | — | 55.4 | ||||
| Median | 1,288 | $920,000 | $920,000 | ||||||||||
Market Analysis
List vs Sale $/SqFt
Sale Price Trend
Days on Market
Sale vs List Price
This analysis was generated automatically from MLS data. For an in-depth, human-reviewed valuation, contact Joseph Sardella at josephsardella@gmail.com.