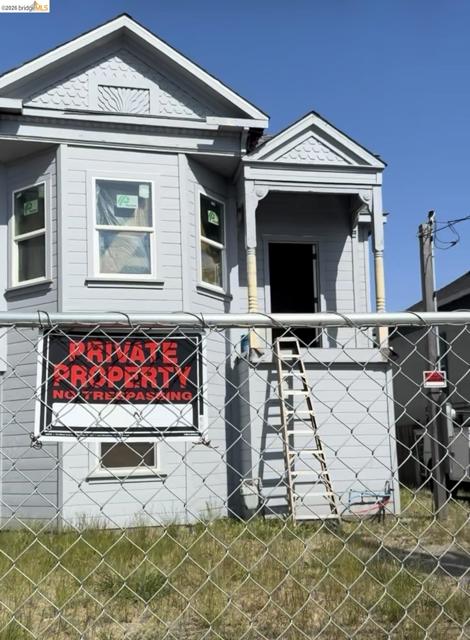
3326 Chestnut St, Oakland, CA 94608
3326 Chestnut St, Oakland, CA 94608
Property Description
Opportunity awaits with this 4-bedroom, 1-bath home offering approximately 1,344 sq. ft. of living space on a generously sized lot. Property requires a full renovation and is best suited for investors or cash buyers. With significant upside potential, this is a great chance to add value and transform the home to its full potential. Bring your vision and restore this property to life.
Features & Amenities
Property Details
Mortgage Calculator
Current Rates
Comparative Market Analysis
Affordable Tier · 5 active · 5 closed
Oakland · Single Family Residence
Listed 13.7% above the median closed sale of $615,000. Price per sqft ($520) is a 14% premium to closed comps ($457). Closed comps sold at 103% of list — strong seller's market.
Price Position
Positioned above the market — commands a premium.
Active Properties (5)
Active Comparables
| Address | City | Year | BD | BTH | SqFt | LotSz | LP/SqFt | LP | DIM | Score |
|---|---|---|---|---|---|---|---|---|---|---|
| 3414 Andover St | Oakland | 1903 | 3 | 1 | 1,320 | 6,000 | $492 | $649,000 | 30 | 82 |
| 2701 Chestnut St | Oakland | 1925 | 3 | 1 | 1,150 | 4,488 | $608 | $699,000 | 37 | 79 |
| 842 33Rd St | Oakland | 1908 | 2 | 1 | 1,107 | 3,235 | $631 | $699,000 | 9 | 78 |
| 792 19Th St | Oakland | 1893 | 3 | 3 | 1,279 | 4,000 | $491 | $628,000 | 2 | 77 |
| 3929 Ruby St | Oakland | 1923 | 4 | 2 | 1,548 | 2,275 | $516 | $799,000 | 23 | 72 |
| Total: 5 · Average | 3.0 | 1.6 | 1,280.8 | 3,999.6 | $547.6 | $694,800 | 20.2 | |||
| Median | 1,279 | $699,000 | ||||||||
Closed Properties (5)
Closed Comparables
| Address | City | Year | Date | BD | BTH | SqFt | LotSz | LP | SP | SP/SqFt | SP/LP | DIM | Score |
|---|---|---|---|---|---|---|---|---|---|---|---|---|---|
| 3239 Adeline St | Oakland | 1895 | 10/28/2026 | 3 | 2 | 1,523 | 2,952 | $599,000 | $705,000 | $463 | 1.18 | 27 | 84 |
| 2517 Filbert St | Oakland | 1888 | 06/02/2026 | 4 | 2 | 1,692 | 4,125 | $699,000 | $702,000 | $415 | 1.00 | 52 | 81 |
| 3237 Linden St | Oakland | 1893 | 01/08/2026 | 2 | 1 | 1,106 | 6,800 | $599,000 | $599,000 | $542 | 1.00 | 56 | 77 |
| 3608 Adeline St | Emeryville | 1911 | 05/08/2026 | 2 | 2 | 1,163 | 2,000 | $599,000 | $615,000 | $529 | 1.03 | 43 | 72 |
| 2542 Filbert St | Oakland | 1907 | 11/26/2025 | 4 | 2 | 1,798 | 2,500 | $630,000 | $606,500 | $337 | 0.96 | 161 | 69 |
| Total: 5 · Average | 3.0 | 1.8 | 1,456.4 | 3,675.4 | $645,500 | $645,500 | $457.2 | — | 67.8 | ||||
| Median | 1,523 | $615,000 | $615,000 | ||||||||||
Market Analysis
List vs Sale $/SqFt
Sale Price Trend
Days on Market
Sale vs List Price
This analysis was generated automatically from MLS data. For an in-depth, human-reviewed valuation, contact Joseph Sardella at josephsardella@gmail.com.