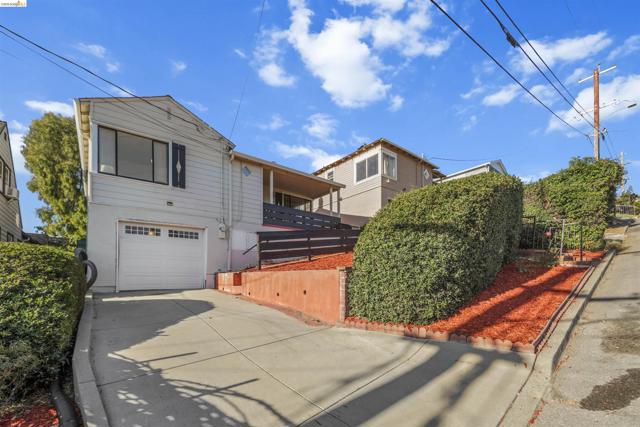
3301 82nd Ave, Oakland, CA 94605
3301 82nd Ave, Oakland, CA 94605
Property Description
Views Views Views. Charming 2-bedroom, 1-bath home located at the top of the hill. Offering convenient access to local shops, schools, and major commuter routes. In home Washer/dryer. This property sits in a well-connected neighborhood with nearby parks, transit options, and everyday amenities just minutes away. The home features a functional layout with comfortable living spaces, making it a great opportunity for first-time buyers, investors, or anyone seeking an affordable single-family residence in a central location.
Features & Amenities
Property Details
Mortgage Calculator
Current Rates
Comparative Market Analysis
Affordable Tier · 5 active · 5 closed
Oakland · Single Family Residence
Listed in line with the median closed sale of $610,000. Closed comps sold at 107% of list — strong seller's market.
Price Position
Aligned with the market — fair pricing for the comps.
Active Properties (5)
Active Comparables
| Address | City | Year | BD | BTH | SqFt | LotSz | LP/SqFt | LP | DIM | Score |
|---|---|---|---|---|---|---|---|---|---|---|
| 8021 Hillside St | Oakland | 1925 | 2 | 1 | 973 | 3,420 | $544 | $529,000 | 6 | 88 |
| 4117 Seacor Ct | Oakland | 1946 | 3 | 1 | 1,104 | 5,925 | $543 | $599,000 | 16 | 80 |
| 7650 Ney Ave | Oakland | 1929 | 3 | 1 | 1,267 | 3,300 | $446 | $565,000 | 31 | 79 |
| 8600 Seneca Street | Oakland | 1948 | 3 | 2 | 1,557 | 6,200 | $366 | $569,950 | 137 | 64 |
| 2401 80th AVE | Oakland | 1939 | 4 | 3 | 1,866 | 3,850 | $348 | $650,000 | 104 | 54 |
| Total: 5 · Average | 3.0 | 1.6 | 1,353.4 | 4,539 | $449.4 | $582,590 | 58.8 | |||
| Median | 1,267 | $569,950 | ||||||||
Closed Properties (5)
Closed Comparables
| Address | City | Year | Date | BD | BTH | SqFt | LotSz | LP | SP | SP/SqFt | SP/LP | DIM | Score |
|---|---|---|---|---|---|---|---|---|---|---|---|---|---|
| 2421 96Th Ave | Oakland | 1941 | 07/27/2026 | 2 | 1 | 963 | 4,140 | $499,000 | $530,000 | $550 | 1.06 | 88 | 87 |
| 3541 68th Ave | Oakland | 1940 | 11/06/2026 | 2 | 1 | 970 | 5,284 | $609,000 | $660,000 | $680 | 1.08 | 0 | 85 |
| 3534 68Th Ave | Oakland | 1931 | 07/21/2026 | 2 | 1 | 894 | 2,822 | $588,000 | $610,000 | $682 | 1.04 | 36 | 84 |
| 7542 Valentine St | Oakland | 1951 | 11/10/2026 | 2 | 1 | 1,016 | 5,460 | $599,000 | $675,000 | $664 | 1.13 | 55 | 84 |
| 2957 73Rd Ave | Oakland | 1927 | 06/10/2026 | 2 | 1 | 1,023 | 3,600 | $499,999 | $525,000 | $513 | 1.05 | 82 | 83 |
| Total: 5 · Average | 2.0 | 1.0 | 973.2 | 4,261.2 | $600,000 | $600,000 | $617.8 | — | 52.2 | ||||
| Median | 970 | $610,000 | $610,000 | ||||||||||
Market Analysis
List vs Sale $/SqFt
Sale Price Trend
Days on Market
Sale vs List Price
This analysis was generated automatically from MLS data. For an in-depth, human-reviewed valuation, contact Joseph Sardella at josephsardella@gmail.com.