1 / 29
325 Valle Vista Ave, 117, Hayward, CA 94544
$270K1bd · 1ba · 598 sqft
Lot 64,567 sqft•HOA $622/mo•Condominium•Active•182d on market•MLS# 00-41135350
325 Valle Vista Ave, 117, Hayward, CA 94544
MLS# 00-41135350•Residential•Condominium
Active182 days on market
$269,950
1
Beds
1
Baths
598
Sq Ft
64,567
Lot Sq Ft
$622
HOA/mo
1984
Year Built
Water
View
Property Description
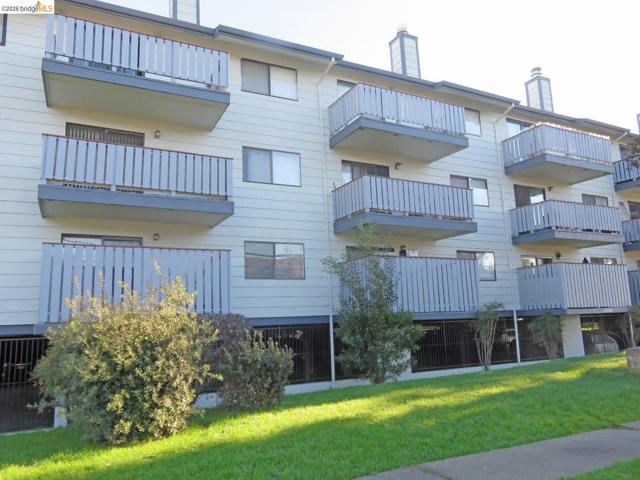
Step into this beautifully updated ground-floor home featuring a spacious private patio. Enjoy a fully remodeled kitchen and bath, stylish luxury vinyl flooring, and fresh paint throughout. This unit maximizes storage with ample closet/cabinet space and includes secure underground parking.
Features & Amenities
FeeBuilt 1984
Property Details
Land Type
Fee
Year Built
1984
Property Type
Residential
Property Subtype
Condominium
Heating
Wall Furnace
View
Water
Flooring
Laminate
City
Hayward
Zip Code
94544
County
Alameda
Mortgage Calculator
Current Rates
$
$
%
Monthly Payment
$1,365.01
Principal & Interest
Loan Amount
$215,960
Total Interest
$275,445
Total Payment Over 30 Years
$491,405
This calculator provides estimates only. Actual mortgage payments may include taxes, insurance, HOA fees, and PMI. Contact a lender for accurate quotes.
Comparative Market Analysis
Affordable Tier · 2 active · 0 closed
325 Valle Vista Ave, 117, Hayward, CA 94544
Hayward · Condominium
$270K
Affordable TierBeds
1
Baths
1
Sqft
598
Lot
1.48 ac
Year
1984
$/Sqft
$451
Pool: No✓
View: water✓
Comparable sales support the current list price.
Price Position
Priced below the market — value advantage over the field.
Price advantage
Subject listed at $270K· $451/sqft
Total list price
Closed compsinsufficient comp data
Active comps
vs active median $299K
−$29K (−9.7%)
Price per sqft
Closed compsinsufficient comp data
Active comps
vs active avg $/sqft $429
+$22 (+5.1%)
Active Properties (2)
Active Comparables
| Address | City | Year | BD | BTH | SqFt | LotSz | LP/SqFt | LP | DIM | Score |
|---|---|---|---|---|---|---|---|---|---|---|
| 260 Industrial Pkwy | Hayward | 1973 | 1 | 1 | 686 | 60,128 | $436 | $299,000 | 53 | 88 |
| 260 Industrial Pkwy | Hayward | 1973 | 1 | 1 | 686 | 61,411 | $422 | $289,500 | 113 | 85 |
| Total: 2 · Average | 1.0 | 1.0 | 686 | 60,769.5 | $429 | $294,250 | 83 | |||
| Median | 686 | $299,000 | ||||||||
Market Analysis
List vs Sale $/SqFt
Sale Price Trend
Days on Market
Sale vs List Price
AI-generated CMA
This analysis was generated automatically from MLS data. For an in-depth, human-reviewed valuation, contact Joseph Sardella at josephsardella@gmail.com.