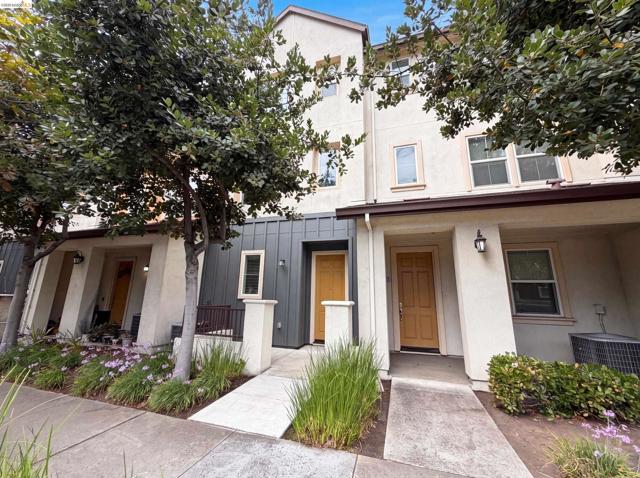
3127 Madsen ST, Hayward, CA 94541
3127 Madsen ST, Hayward, CA 94541
Property Description
3127 Madsen St is a three-story Hayward townhome built in 2011 with an open main level. The kitchen features granite countertops, white cabinetry, stainless steel appliances, and a breakfast bar that opens to the dining and living areas for connected everyday use. Hardwood flooring runs through the main level, with large windows bringing in natural light. The bedrooms provide flexible space with carpeting, and the primary bathroom offers a dual-sink vanity and a separate glass shower, while additional bathrooms provide tub and shower combinations. A dedicated laundry area, a walk-in closet, and an attached garage add storage and utility. This multi-level layout completes a well-maintained residence with practical amenities throughout.
Features & Amenities
Property Details
Mortgage Calculator
Current Rates
Comparative Market Analysis
Affordable Tier · 2 active · 5 closed
Hayward · Condominium
Listed in line with the median closed sale of $650,000. Closed comps sold at 102% of list — strong seller's market.
Price Position
Aligned with the market — fair pricing for the comps.
Active Properties (2)
Active Comparables
| Address | City | Year | BD | BTH | SqFt | LotSz | LP/SqFt | LP | DIM | Score |
|---|---|---|---|---|---|---|---|---|---|---|
| 500 Somi CT | Hayward | 2026 | 3 | 2 | 1,407 | 0 | $437 | $615,000 | 68 | 62 |
| 500 Somi Ct | Hayward | 2026 | 2 | 2 | 1,124 | 0 | $520 | $585,000 | 44 | 56 |
| Total: 2 · Average | 2.5 | 2.0 | 1,265.5 | 0 | $478.5 | $600,000 | 56 | |||
| Median | 1,407 | $615,000 | ||||||||
Closed Properties (5)
Closed Comparables
| Address | City | Year | Date | BD | BTH | SqFt | LotSz | LP | SP | SP/SqFt | SP/LP | DIM | Score |
|---|---|---|---|---|---|---|---|---|---|---|---|---|---|
| 710 City Walk Pl | Hayward | 2001 | 09/28/2026 | 3 | 3 | 1,418 | 149,648 | $650,000 | $680,000 | $480 | 1.05 | 35 | 83 |
| 22737 Watkins St | Hayward | 2005 | 10/01/2026 | 3 | 3 | 1,454 | 44,523 | $650,000 | $650,000 | $447 | 1.00 | 76 | 82 |
| 612 Staley Ave | Hayward | 2012 | 12/30/2025 | 2 | 3 | 1,227 | 15,036 | $659,999 | $680,000 | $554 | 1.03 | 110 | 79 |
| 710 City Walk Pl | Hayward | 2001 | 03/02/2026 | 3 | 3 | 1,361 | 149,648 | $649,000 | $649,000 | $477 | 1.00 | 45 | 78 |
| 410 Puerto Pl | Hayward | 1980 | 05/11/2026 | 2 | 3 | 1,412 | 118,537 | $625,000 | $630,000 | $446 | 1.01 | 59 | 71 |
| Total: 5 · Average | 2.6 | 3.0 | 1,374.4 | 95,478.4 | $657,800 | $657,800 | $480.8 | — | 65 | ||||
| Median | 1,412 | $650,000 | $650,000 | ||||||||||
Market Analysis
List vs Sale $/SqFt
Sale Price Trend
Days on Market
Sale vs List Price
This analysis was generated automatically from MLS data. For an in-depth, human-reviewed valuation, contact Joseph Sardella at josephsardella@gmail.com.